Port Statistics, June 2026 Report

Monthly cargo throughput for the San Pedro Bay Port Complex, tracking POLA and POLB TEU data, tariff impacts on exports, empty container trends, and what it means for LA industrial real estate.

June 2026 Report

Port of Los Angeles

1,002,734

▲ +12.4% Year-over-Year

Metric June 2026 June 2025
Loaded Imports 530,558 470,450
Loaded Exports 126,365 126,144
Total Loaded 656,923 596,594
Total Empty 345,811 295,746
Total TEUs 1,002,734 892,340

Port of Long Beach

779,331

▲ +10.6% Year-over-Year

Metric June 2026 June 2025
Loaded Imports 387,025 348,681
Loaded Exports 86,446 87,627
Total Loaded 473,471 436,308
Total Empty 305,860 268,095
Total TEUs 779,331 704,403
San Pedro Bay Combined
1,782,065 TEUs
▲ +11.6% Year-over-Year

What This Means for Industrial

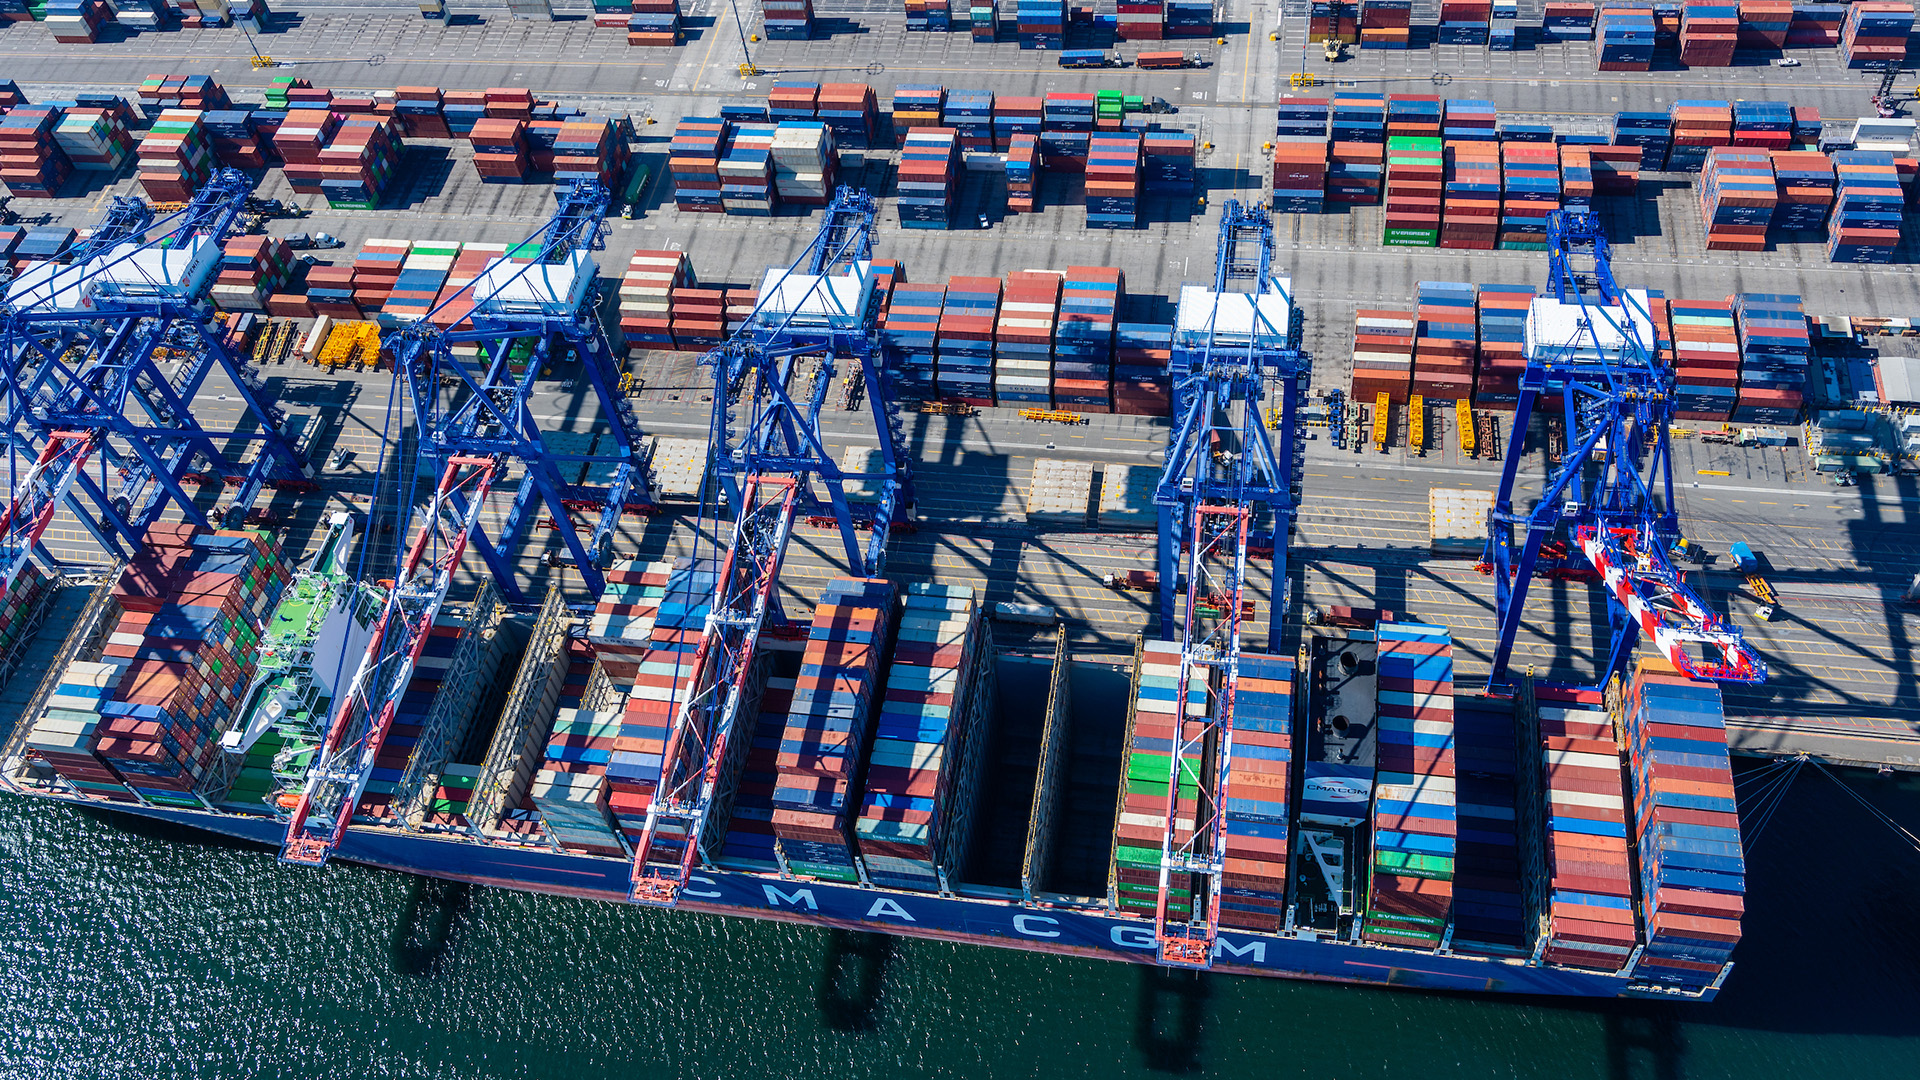
The San Pedro Bay port complex moved 1.78 million TEUs in June, an 11.6% increase over the same month last year. The headline number is driven almost entirely by the Port of Los Angeles, which crossed the 1 million TEU mark for only the third time in its history. POLA surged 12.4% year-over-year to 1,002,734 TEUs while POLB gained a more modest 10.6% to 779,331. The divergence is stark: POLA captured 56% of combined throughput, continuing a share-shift trend that has defined the first half of 2026.

The import surge is textbook tariff front-loading. With the 10% Section 122 universal import surcharge set to expire July 24, retailers and manufacturers accelerated shipments to beat the deadline. POLA Executive Director Gene Seroka confirmed that businesses are “moving cargo whenever conditions are favorable rather than following traditional seasonal shipping patterns.” Loaded imports at POLA hit 530,558 TEUs, the port’s third-highest import month on record. For industrial landlords in the South Bay and Harbor Gateway, this means continued strong demand for inbound logistics space, but the question is whether July and August will see a cliff as the tariff deadline passes.

On the export side, the picture is more nuanced. POLA loaded exports held flat at 126,365 TEUs compared to 126,144 last June, a remarkable stabilization after months of volatility. POLB exports dipped slightly to 86,446, down 1.3% year-over-year. The year-to-date trend still favors POLA: outbound traffic is up 28.5% through six months at Los Angeles while Long Beach exports are up 10.7%. The export resilience at POLA suggests some shippers are consolidating outbound flows through LA terminals to maintain sailings, a trend with implications for export-facing tenants in the Gateway Cities submarket.

Empty containers tell a divergent story. POLA empties rose 17% in June to 345,811 TEUs as equipment returned to Asia to support continued import demand. POLB empties increased 14% to 305,860. Year-to-date, POLB’s empty ratio sits at 38.6% versus POLA’s 33.8%. The widening gap in empty ratios reflects the structural trade imbalance: more containers returning empty to Asia means import dominance continues. For warehouse and distribution operators, this signals sustained demand for inbound handling space, but also mounting pressure on export capacity. The rising empty flow at both ports suggests that even with tariff changes, the fundamental import-heavy trade pattern persists.

The bottom line: June’s record-breaking numbers are a tariff-driven surge that may not sustain through the back half of 2026. Industrial tenants and landlords should watch July and August volumes closely for signs of a post-deadline pullback. If imports normalize after July 24, the second half could see softer demand for port-adjacent warehouse space. But with POLA’s fiscal year closing at 10.4 million TEUs and year-to-date combined volume up 2.6%, the underlying demand foundation remains solid. The key variable is whether the Section 122 expiration brings relief or triggers a new round of trade policy uncertainty.

Monthly TEU Comparison: 2025 vs 2026

0 0.5M 1.0M 1.5M 2.0M 1.88M 1.66M Jan 1.57M 1.59M Feb 1.60M 1.53M Mar 1.71M 1.71M Apr 1.36M 1.68M May 1.60M 1.78M Jun 1.96M n/a Jul 1.86M n/a Aug 1.68M n/a Sep 1.69M n/a Oct 1.60M n/a Nov 1.63M n/a Dec 2025 2026 Peak Season (Jul-Oct)

Month POLA POLB Combined YoY %
Jul 2025 1,019,836 944,233 1,964,070 +7.8%
Aug 2025 901,845 958,355 1,860,200 -0.8%
Sep 2025 797,537 883,053 1,680,590 -5.8%
Oct 2025 839,673 848,424 1,688,097 -10.8%
Nov 2025 817,561 782,249 1,599,810 -9.5%
Dec 2025 834,118 791,588 1,625,706 -8.8%
Jan 2026 812,000 847,766 1,659,766 -11.6%
Feb 2026 824,323 767,526 1,591,849 +1.6%
Mar 2026 752,520 774,936 1,527,456 -4.3%
Apr 2026 890,861 817,993 1,708,854 -0.1%
May 2026 840,164 842,031 1,682,196 +24.1%
Jun 2026 1,002,734 779,331 1,782,065 +11.6%
Peak Season (Jul-Oct)
Data sourced from Port of Los Angeles and Port of Long Beach monthly container statistics.
Prior month data published mid-month. Last Updated: July 16, 2026.

Drayage Rate Index, July 2026 Report

Drayage rates and cost trends for the San Pedro Bay Port Complex, tracking base rates, fuel surcharges, chassis fees, and the full fee stack that drives landed cost for LA industrial real estate.

Drayage Rate Index, July 2026

San Pedro Bay Port Complex | Updated July 16, 2026
Base Drayage Rate
40′ dry container, local move, port to warehouse within 25 miles
$285 - $420 per move
+4% YoY
LOW HIGH AVG
20′ Container $275 $425 $350
40′ Container $325 $525 $425
All-In (40′) $525 $925 $725
Fuel Surcharge
Percentage of base rate, tracks EIA CA diesel index monthly
22 - 30%
CA Diesel +52% Feb-Apr 2026
RATE BASIS
PierPass / TMF $35 per TEU
Clean Truck Fund $10 per TEU
Chassis Split $35-$55 per move
Port Congestion $50-$150 per move
All-In Cost per 40′ Container
$525 - $925 base + fuel + chassis + fees
LA/LB rates run 20-35% above national average

What This Means for Industrial

Drayage is the connective tissue between port throughput and warehouse demand. When rates spike, it signals congestion at the terminals, chassis shortages, or fuel pressure, all of which ripple into industrial real estate decisions. Importers facing higher drayage costs tend to pull distribution closer to the ports or seek inland sites with rail access to bypass trucking entirely.

The CA diesel spike from $4.87/gal in February to $7.42/gal in April 2026 drove fuel surcharges from the low end of the range toward the high end, pushing all-in costs from roughly $600 to $850 per move. Diesel has since moderated to $6.67/gal in June, a 10% retreat from the April peak but still 37% above February. All-in costs have eased back toward $750 per move as fuel surcharges settle toward the middle of the 22-30% range. At 5,000 containers per year, the residual fuel premium still represents roughly $750K in additional landed cost annually compared to pre-spike levels.

C.H. Robinson’s July 2026 Edge Report characterizes the port and drayage market as stable with localized friction rather than widespread disruption. Most U.S. inland networks are operating without major interruption, though corridor-specific disruptions like the I-65 closure through Louisville and European port congestion at Antwerp and Rotterdam require closer planning. For industrial tenants, the diesel moderation is welcome but the structural cost floor from CARB zero-emission mandates and chassis availability constraints means proximity to the San Pedro Bay complex remains a premium worth pricing into lease decisions.

Fee Stack: Anatomy of a Drayage Invoice

Line Item Typical Charge What It Covers
Base Drayage $425 Single move: terminal to warehouse, return empty
Fuel Surcharge (25%) $106 Adjusts weekly with EIA diesel index
Chassis Usage (3 days) $120 Pool chassis rental, first day often included
PierPass / Clean Truck $45 Off-peak entry fee + emissions program
TMF / Gate Move $35 Terminal handling fee per gate transaction
Pre-Pull (optional) $125 Pull from terminal early to avoid demurrage
Subtotal (no exceptions) $731 - $856 Routine import to local warehouse
Driver Wait (after free hr) $75-$125/hr Detention at shipper or receiver
Demurrage (per day) $150-$350 Container left at terminal past free time
Per Diem (chassis/container) $75-$200/day Equipment held past free days

CA Diesel vs WTI: Fuel Cost Driver

Month CA Diesel ($/gal) WTI ($/bbl) Drayage Impact
Jan 2026 $4.66 $60.04 Normal range
Feb 2026 $4.87 $64.51 Normal range
Mar 2026 $6.32 $91.38 Surcharge spike begins
Apr 2026 $7.42 $100.32 Peak surcharge pressure
May 2026 $7.27 $102.13 Sustained high surcharge
Jun 2026 $6.67 $84.81 Moderating, still elevated

National Port Comparison: 40′ Local Drayage (Q1 2026)

Port / Metro Base Rate All-In vs LA/LB
Los Angeles / Long Beach $325-$525 $525-$925 Baseline (highest US)
Oakland $350-$550 $575-$925 +2% to +6%
New York / New Jersey $350-$525 $550-$900 -3% to -3%
Seattle / Tacoma $325-$500 $525-$875 -4% to -5%
Miami / Port Everglades $325-$500 $525-$850 -3% to -8%
Norfolk / Virginia $300-$475 $475-$800 -9% to -13%
Savannah $275-$425 $425-$725 -19% to -22%
Houston $275-$450 $425-$750 -19% to -19%
Charleston $275-$450 $425-$750 -19% to -19%

Market Context: Drivers and Pressures

Factor Status (Jul 2026) Rate Impact
National Drayage Spot Index +8 to +9.2% YoY Elevated but moderating with diesel retreat
Market stability Stable networks, localized friction (Jul 2026) Port access and appointment timing, not systemic congestion
CA diesel price $6.67/gal (Jun 2026), down from $7.42 Apr peak Fuel surcharge settling mid-range, 10% below peak
Free time at LA/LB terminals 2-4 days (down from 5-7 pre-2020) Higher demurrage exposure per container
FMCSA non-domiciled CDL rule Active, reducing driver pool Upward pressure on base rates
CARB zero-emission mandate 100% ZEV drayage by 2035 Two-tier market: ZEV premium vs diesel competitive
Chassis availability Primary rate driver during peak season Split fees and pre-pulls more frequent
I-65 Louisville closure Active through July 31, 5-mile stretch 30-90 min added transit, Midwest-Southeast corridor

Developers Are Back to Building U.S. Warehouses: What It Means for the South Bay

The Turn

After a two-year construction slump, U.S. warehouse development is accelerating again. More than 305 million square feet of industrial real estate was under construction nationwide in the second quarter of 2026, up 18% year-over-year and marking the second consecutive quarter of annual growth, according to Cushman & Wakefield.

Q2 leasing volume was the strongest since mid-2022, giving developers the confidence to break ground on new projects. Prologis plans $4.5 to $5.5 billion in development starts this year, up from $3.1 billion in 2025. Panattoni, based in Irvine, is ramping up starts by 62% over last year.

But the pipeline remains well below the pandemic-era peak of 725 million square feet under construction in Q3 2022. As Doug Roberts, Panattoni’s president of North American development, put it: “We’re still cautiously optimistic, but nowhere near what it was three, four years ago.”

What’s Driving the Comeback

The demand picture has shifted from the pandemic’s e-commerce surge to a more diversified set of drivers:

  • Data centers and AI infrastructure – Prologis expects 40% of its 2026 development starts to be data centers, responding to the rapid build-out of AI computing capacity nationwide.
  • Tariff-driven inventory stocking – Retailers are leasing space to warehouse goods ahead of potential tariff changes, pulling demand forward.
  • Manufacturing reshoring – Companies bringing operations into the U.S. need industrial space, supporting a structural rather than cyclical demand layer.
  • Third-party logistics growth – 3PLs are expanding to meet outsourced fulfillment needs.
  • Supply-chain diversification – As Henry Steinberg of EQT Real Estate noted, tenants are seeking to mitigate risk from port backlogs, tariffs, and natural disasters by creating more diversity in their supply chains.

What This Means for the South Bay

The national trend has specific implications for the Carson, Wilmington, and Torrance industrial corridor that we track daily:

Port-proximate markets are the first to feel the shift. The same tariff concerns driving national leasing demand are amplified here, where tenants depend on POLB and POLA throughput. We are already seeing tenants who paused renewals in 2024 and 2025 returning to the market, often with shorter decision cycles.

New construction in this market remains constrained. The South Bay lacks the large developable parcels available in Inland Empire or the Houston market. What gets built here is infill and redevelopment, not greenfield. That means existing space commands a premium when demand accelerates, and it means tenants who locked in rates in 2023 and 2024 are sitting on increasingly favorable lease positions.

Data-center demand is not a primary driver locally – yet. The South Bay’s industrial stock is weighted toward logistics, transload, and container freight operations. But the secondary effect is real: as data-center operators absorb space in Inland Empire and the High Desert, traditional logistics users get pushed toward port-proximate submarkets like ours.

The Risk Side

The development rebound is not without headwinds. The Federal Reserve has signaled potential rate hikes if inflation persists. Consumer sentiment remains near record lows. And companies pulling holiday merchandise forward to get ahead of tariff costs and Iran war-related disruptions are expected to reduce imports later in the year, which could soften near-term port-adjacent demand.

Jeremy Garner of Trammell Crow noted that coastal markets where construction had slowed are “seeing green shoots now and reasons to move forward with more development.” The question for our market is whether those green shoots translate into speculative starts or remain driven by pre-leased demand.

Bottom Line

The industrial market is turning a corner, but it is a measured turn, not a return to 2022. For South Bay tenants, the window to secure favorable lease terms is narrowing. For landlords, the pressure to fill vacant space is easing, but concessions remain available for creditworthy tenants willing to commit to longer terms.

Source: Liz Young, “Developers Are Back to Building U.S. Warehouses,” Wall Street Journal Logistics Report, July 15, 2026.

Vesperlight Real Estate Services tracks South Bay industrial market conditions daily through AIR CRE data, port statistics, and direct broker relationships. Contact us for current market intelligence specific to your submarket.

SB 415 Warehouse Standards Update: What CRE Pros Need to Know After the Industry Town Hall

California’s logistics and industrial real-estate community has entered a new phase of clarity and implementation following the passage of Senate Bill 415 (SB 415) in October 2025 — the legislative refinement to the landmark warehouse siting and design framework established in Assembly Bill 98 (AB 98) in 2024. SB 415 was devised to fix early implementation challenges that jeopardized feasibility for many logistics projects.

On November 20, 2025, industry stakeholders, local officials, developers, and land-use consultants convened at a Town Hall hosted by AIR CRE and featuring expert commentary led by Skyler Wonnacott of the California Business Properties Association (CBPA).

The discussion provided the most detailed public walkthrough yet of SB 415’s mechanics, compliance pathways, and remaining gaps — and confirmed that the law is now operational, but not yet settled in practice.


What SB 415 Fixed — Town Hall Takeaways 

The Town Hall session underscored SB 415’s role as an implementation-ready update rather than a reversal of AB 98. Key points emphasized included: 

  1. Clearer Scope with “Logistics Use Development”

SB 415 establishes a solid baseline for what qualifies as a covered logistics project: 

  • single building 
  • Primarily for warehousing/storage for distribution to business or retail customers 
  • Involving heavy-duty trucks 

The session confirmed that ancillary industrial uses — like manufacturing or agriculture (below 90 days of seasonal use) — remain excluded, avoiding overreach into unrelated industrial real-estate categories.  


  1. Thresholds & Triggers Fine-Tuned

A building enters the Warehouse Standards framework if it is 250,000+ square feet per building, not on a cumulative site basis — a key clarification for multi-building logistics parks. Office space no longer contributes to the 250,000 sf metric.  

Town Hall Q&A solidified interpretations around expansions, mezzanine additions, and what kind of improvements might or might not trigger compliance, which is critical for owners planning phased expansions or redevelopment.  


  1. Sensitive Receptor Proximity Matters

Design and mitigation requirements only kick in if a loading bay is within 900 feet of a sensitive receptor — including homes, schools, daycares, or actively used playgrounds. Passive parks alone do not count, helping reduce over-application of design restrictions in contexts where community exposure is minimal.  

This clarification gives developers confidence to pre-screen properties in early feasibility.  


  1. Buffers, Setbacks & Real-World Feasibility

The session walked through setback, screening, and noise/light mitigation requirements — but also acknowledged that strict “opposite side dock orientation” provisions from early AB 98 language were no longer enforced.

SB 415 now requires dock doors to face away from the closest sensitive receptor “to the extent feasible,” a major win for modern cross-dock logistics design 

Other elements reinforced practicality: 

  • Buffer areas may include landscaping, walkways, parking, and even public rights-of-way 
  • single truck entrance with dedicated lanes satisfies circulation requirements 
  • Anti-idling rules apply only when power capacity is sufficient for plug-in alternatives  


What the Town Hall Identified as Unresolved 

Despite broad progress, the November 20 discussion highlighted three areas still lacking legislative or regulatory closure: 

  1. Redevelopment Treatment Still a Problem: Under current law, demolition followed by rebuild is treated as new development and fully subject to Warehouse Standards. The Town Hall flagged this as a major pain point for infill redevelopment, especially in legacy industrial markets where modernization is key. Industry groups have signaled this will be a top priority in 2026 
  2. Local Implementation Variability: While SB 415 provided statewide definitions, local agencies are still building interpretation frameworks. How towns map sensitive receptors, adopt truck routes, and interpret setbacks will determine real-world feasibility in specific submarkets. The Town Hall made clear that best practices are emerging, but not uniform 
  3. Enforcement & Monitoring: SB 415 requires updated circulation elements and truck-routing plan adoption by cities and counties. However, enforcement — particularly how the Attorney General will evaluate good-faith efforts vs. noncompliance — remains unresolved. There’s also ongoing uncertainty around how environmental monitoring data (e.g., air quality metrics in industrial zones) will influence future policy evolution.  


Why This Matters to CRE Professionals 

For brokers, developers, investors, and land-use consultants, the November Town Hall did more than recap statutory language — it connected regulatory text to entitlements and asset strategy: 

✔️ Feasibility modeling is now possible: Owners can determine whether a site is subject to the Standards with confidence. 
✔️ Design pipelines are clearer: Standard metrics for setbacks, buffers, and truck circulation allow predictable cost-estimating and program planning. 
✔️ Cross-dock viability preserved: Logistically efficient layouts will no longer be prohibited by rigid orientation rules. 
✔️ Sensitive receptor mapping matters more than ever: CRE teams must integrate this into underwriting and site selection workflows.  


Looking Ahead: What’s Next 

With SB 415 now in effect and the implementation phase underway, the CRE community should be watching for: 

📌 Model ordinances and circulation element updates from cities and counties — which will define truck routing in markets statewide. 

📌 Future legislation addressing redevelopment and modernization exemptions. 

📌 Emerging enforcement guidance from state authorities that will shape how jurisdictions comply and how strictly standards are applied. 

Conflicting economic signals confound policymaking

According to CoStar Analytics, economic uncertainty in commercial real estate is intensifying as mixed inflation and labor market signals challenge Federal Reserve policy. These conflicting indicators are creating caution in leasing, financing, and investment decisions.

Key highlights include:

  • Ongoing rate volatility impacting financing, development, and acquisitions

  • Labor market moderation potentially influencing tenant demand and leasing activity

  • Strategic planning is critical amid policy and market uncertainty

Read the full article on CoStar.com

South Bay Industrial Real Estate 2025 – Upside Down and Other Stranger Things

Why newly developed buildings are sitting vacant while older and cheaper buildings curry favor with today’s tenants. Despite clear efficiencies and short-term discounts, there’s no appetite…

Generally, industrial product is led by the newest and most modern buildings in the marketplace. In addition to being free of deferred maintenance and built with industry ideals in mind, these structures often leverage efficiencies not found in older properties—more effective loading strategies, strategically placed core components, more product volume due to height efficiencies, enhanced product breadth due to fire/life system enhancements and environmental systems designed to reduce utility costs while promoting a more sustainable image.

While occasionally occupied by local operators, newly developed buildings are largely designed to attract multi-regional or multinational corporations. These users recognize the long-term operational benefits and are typically willing to pay a premium for that efficiency. Developers know this—but also acknowledge the high risk in speculative construction. Multiple developers have noted that speculative warehouse development carries razor-thin margins, where one misstep can jeopardize the entire pro forma.

But even a sound strategy can fall to macro conditions. In rare cases, the industrial market undergoes what we call a market inversion: a reversal where tenants prioritize affordability over efficiency. The goal becomes to survive, not to optimize. This is precisely what we’re seeing in 2025.

Brand-new Class A buildings, typically prized for their long-term value, are sitting idle. As of this writing, 13 newly developed buildings in the region remain unleased, each marketed for over 300 days. Some have been on the market for more than 800 days irrespective of their completion dates.

Owners are beginning to blink. Several have introduced aggressive short-term lease discounts, hoping to generate occupancy momentum and meet underwriting benchmarks down the road. But even with killer deals, absorption remains low.  For many tenants, it’s too risky to take the short-term win if doing so means misjudging the timing of a rate reset when lease terms normalize back to ownership’s targets. Others see short-term deals as too brief to justify the effort of occupancy—especially if they can’t capitalize on long-term market leverage or strategic growth during the term.  Getting a great rate to gain a market advantage feels like a pyrrhic victory if you are licensing out storage space because there isn’t enough business to fill it.

So far this year, fewer than five of these newly constructed buildings have transacted. That tells us what we need to know: there’s simply no appetite for new regional or national companies to enter the market, and those already present are not expanding.

Until broader economic indicators recover and tenant growth resumes, older, lower-cost industrial buildings may continue to outperform their Class A counterparts—regardless of how modern or efficient the design. In this upside-down cycle, affordability wins.