Commercial Capital Markets Rate Tracker

Weekly tracking of commercial loan rates and U.S. Treasury yields. Our commercial capital markets dashboard tracks weekly commercial loan rates across major programs and U.S. Treasury yields. Data is updated weekly and aggregated over time to reveal trends in borrowing costs and the interest rate environment.

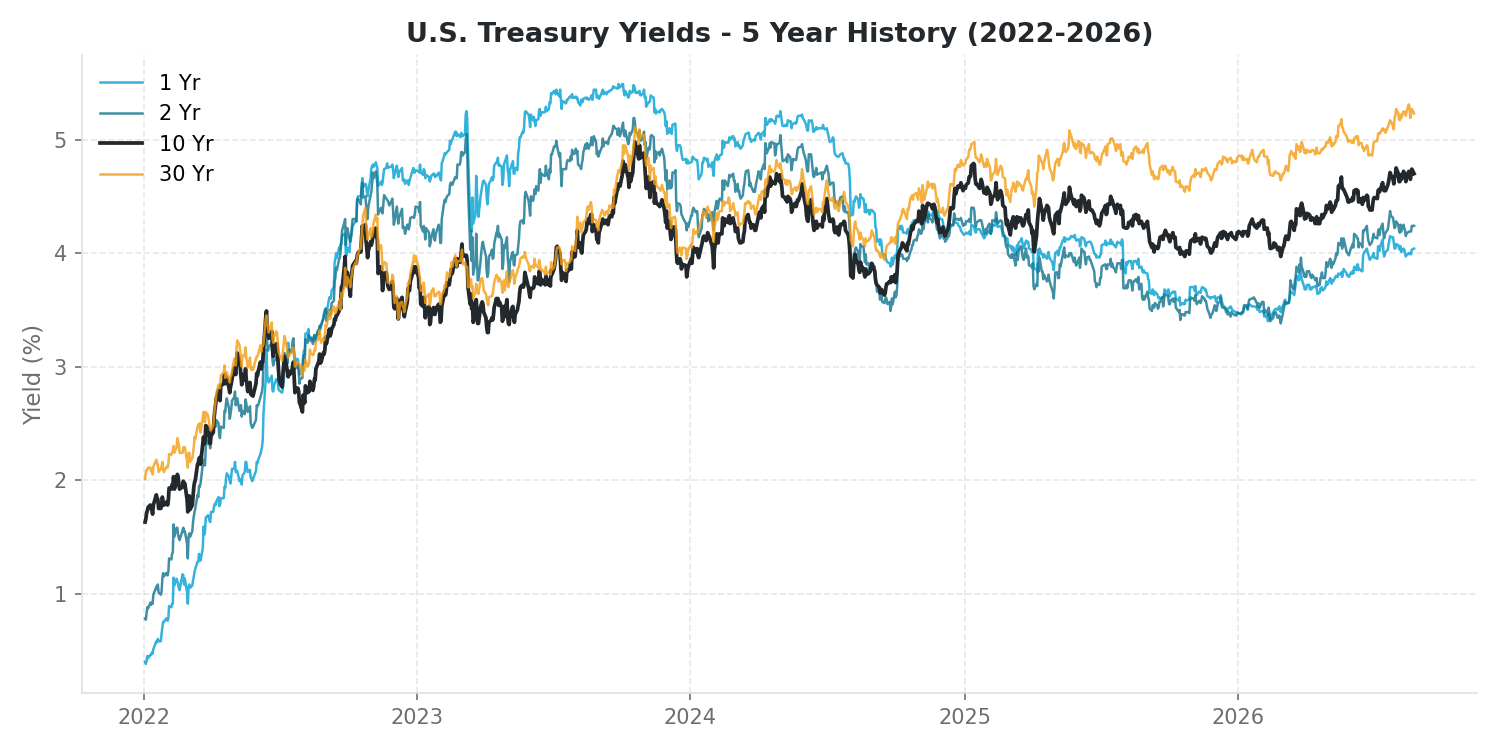
U.S. Treasury Yields

Treasury par yield curve rates for 1, 2, 10, and 30 year maturities. Source: U.S. Department of the Treasury, daily par yield curve rates. Latest data: August 24, 2026.

U.S. Treasury Yields - 5 Year History (2022-2026)

Trend Summary

Quarter Change (QoQ)

1 Yr+25 bps (3.79 to 4.04)
2 Yr+26 bps (3.98 to 4.24)
10 Yr+25 bps (4.45 to 4.70)
30 Yr+24 bps (4.99 to 5.23)

Year Over Year (YoY)

1 Yr+17 bps (3.87 to 4.04)
2 Yr+55 bps (3.69 to 4.24)
10 Yr+47 bps (4.23 to 4.70)
30 Yr+42 bps (4.81 to 5.23)

QoQ compares August 24, 2026 to May 29, 2026. YoY compares August 24, 2026 to August 1, 2025. Basis points (bps): 1 bp = 0.01%.

Date 1 Yr (%) 2 Yr (%) 10 Yr (%) 30 Yr (%)
Aug 24, 2026 4.04 4.24 4.70 5.23
Aug 21, 2026 4.03 4.24 4.74 5.27
Aug 14, 2026 3.98 4.17 4.68 5.25
Aug 7, 2026 4.01 4.19 4.65 5.19
Jul 31, 2026 4.08 4.28 4.75 5.27
Jul 24, 2026 4.14 4.33 4.69 5.16
Jul 17, 2026 4.01 4.18 4.55 5.06

Commercial Loan Rates

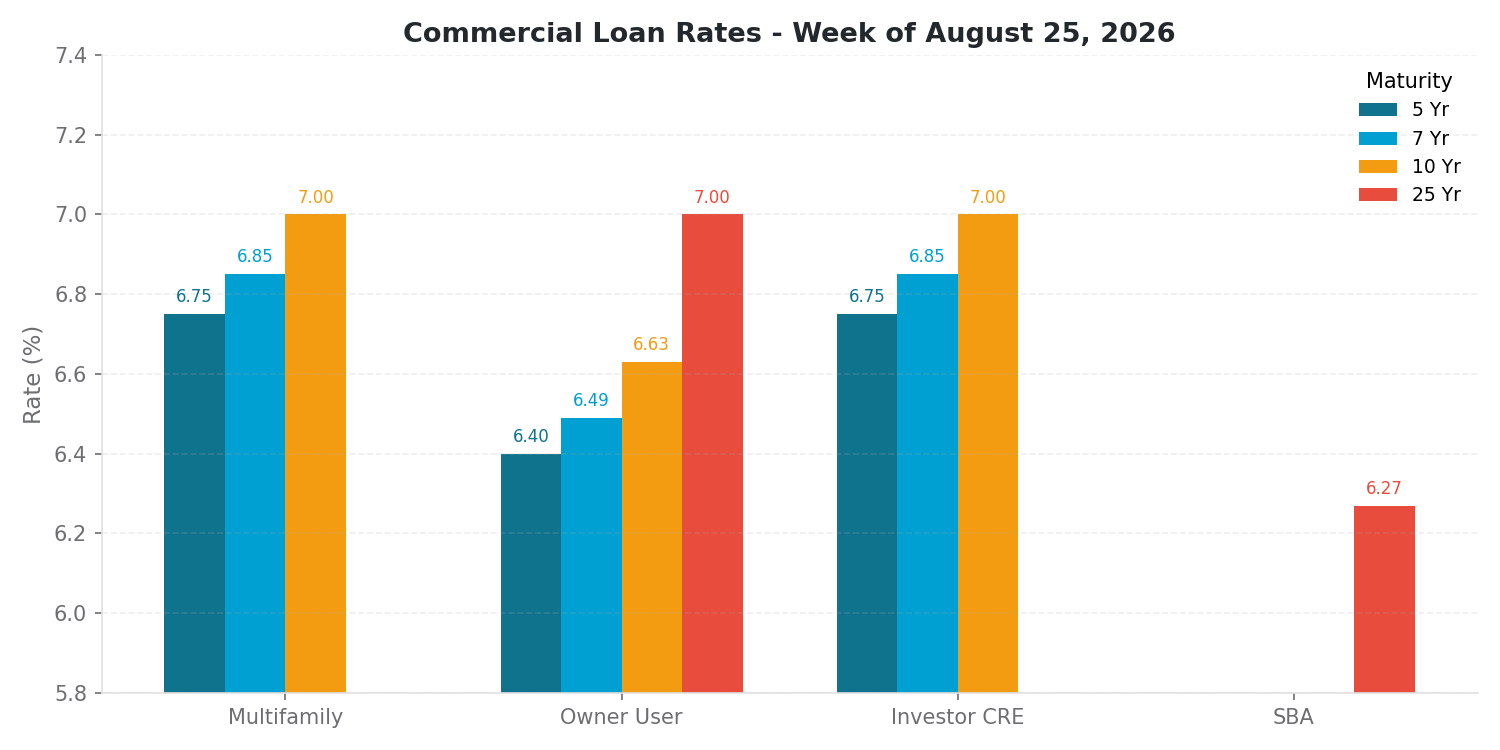
Weekly commercial capital markets rates for $1MM to $50MM loans. Source: DH Financing. Rates subject to underwriting, borrower qualifications, property type, leverage, and market conditions. Week of August 25, 2026.

Commercial Loan Rates - Week of August 25, 2026

Trend Summary

Month Change (Aug 4 to Aug 25)

Multifamily 5 Yr+10 bps
Multifamily 7 Yr+10 bps
Multifamily 10 Yr+3 bps
Owner User 5 Yr+15 bps
Owner User 10 Yr+13 bps
Owner User 25 Yr+25 bps
Investor CREFlat
SBA 25 Yr+10 bps

Year over year comparison not available. DH Financing rate sheet data collection began August 4, 2026.

Program 5 Year (%) 7 Year (%) 10 Year (%) 25 Year (%)
Multifamily 6.75 6.85 7.00
Owner User 6.40 6.49 6.63 7.00
Investor CRE 6.75 6.85 7.00
SBA 6.27

Commercial rates provided by DH Financing. Treasury yields sourced from U.S. Department of the Treasury daily par yield curve rates. Data for informational purposes only; not a commitment to lend. Updated weekly.

Drayage Rate Index, August 2026 Report

Drayage rates and cost trends for the San Pedro Bay Port Complex, tracking base rates, fuel surcharges, chassis fees, and the full fee stack that drives landed cost for LA industrial real estate.

Drayage Rate Index, August 2026

San Pedro Bay Port Complex | Updated August 16, 2026
Base Drayage Rate
40′ dry container, local move, port to warehouse within 25 miles
$285 - $420 per move
+4% YoY
LOW HIGH AVG
20′ Container $275 $425 $350
40′ Container $325 $525 $425
All-In (40′) $525 $925 $725
Fuel Surcharge
Percentage of base rate, tracks EIA CA diesel index monthly
22 - 30%
CA Diesel +30% Feb-Jul 2026
RATE BASIS
PierPass / TMF $35 per TEU
Clean Truck Fund $10 per TEU
Chassis Split $35-$55 per move
Port Congestion $50-$150 per move
All-In Cost per 40′ Container
$525 - $925 base + fuel + chassis + fees
LA/LB rates run 20-35% above national average

What This Means for Industrial

Drayage is the connective tissue between port throughput and warehouse demand. When rates spike, it signals congestion at the terminals, chassis shortages, or fuel pressure, all of which ripple into industrial real estate decisions. Importers facing higher drayage costs tend to pull distribution closer to the ports or seek inland sites with rail access to bypass trucking entirely.

The CA diesel spike from $4.87/gal in February to $7.42/gal in April 2026 drove fuel surcharges from the low end of the range toward the high end, pushing all-in costs from roughly $600 to $850 per move. Diesel has continued to moderate through the summer, falling to $6.34/gal in July, a 15% retreat from the April peak but still 30% above February. WTI crude has also eased to $80.46/bbl, down from $102.13 in May. All-in costs have settled toward $700 per move as fuel surcharges drift toward the lower half of the 22-30% range. At 5,000 containers per year, the residual fuel premium still represents roughly $500K in additional landed cost annually compared to pre-spike levels.

C.H. Robinson’s July 2026 Edge Report characterized the port and drayage market as stable with localized friction rather than widespread disruption. Most U.S. inland networks are operating without major interruption, though corridor-specific disruptions require closer planning. For industrial tenants, the continued diesel moderation through July is welcome, but the structural cost floor from CARB zero-emission mandates and chassis availability constraints means proximity to the San Pedro Bay complex remains a premium worth pricing into lease decisions.

Fee Stack: Anatomy of a Drayage Invoice

Line Item Typical Charge What It Covers
Base Drayage $425 Single move: terminal to warehouse, return empty
Fuel Surcharge (25%) $106 Adjusts weekly with EIA diesel index
Chassis Usage (3 days) $120 Pool chassis rental, first day often included
PierPass / Clean Truck $45 Off-peak entry fee + emissions program
TMF / Gate Move $35 Terminal handling fee per gate transaction
Pre-Pull (optional) $125 Pull from terminal early to avoid demurrage
Subtotal (no exceptions) $731 - $856 Routine import to local warehouse
Driver Wait (after free hr) $75-$125/hr Detention at shipper or receiver
Demurrage (per day) $150-$350 Container left at terminal past free time
Per Diem (chassis/container) $75-$200/day Equipment held past free days

CA Diesel vs WTI: Fuel Cost Driver

Month CA Diesel ($/gal) WTI ($/bbl) Drayage Impact
Feb 2026 $4.87 $64.51 Normal range
Mar 2026 $6.32 $91.38 Surcharge spike begins
Apr 2026 $7.42 $100.32 Peak surcharge pressure
May 2026 $7.27 $102.13 Sustained high surcharge
Jun 2026 $6.67 $84.81 Moderating, still elevated
Jul 2026 $6.34 $80.46 Continued moderation, 15% below peak

National Port Comparison: 40′ Local Drayage (Q1 2026)

Port / Metro Base Rate All-In vs LA/LB
Los Angeles / Long Beach $325-$525 $525-$925 Baseline (highest US)
Oakland $350-$550 $575-$925 +2% to +6%
New York / New Jersey $350-$525 $550-$900 -3% to -3%
Seattle / Tacoma $325-$500 $525-$875 -4% to -5%
Miami / Port Everglades $325-$500 $525-$850 -3% to -8%
Norfolk / Virginia $300-$475 $475-$800 -9% to -13%
Savannah $275-$425 $425-$725 -19% to -22%
Houston $275-$450 $425-$750 -19% to -19%
Charleston $275-$450 $425-$750 -19% to -19%

Market Context: Drivers and Pressures

Factor Status (Aug 2026) Rate Impact
National Drayage Spot Index +8 to +9.2% YoY Elevated but moderating with diesel retreat
Market stability Stable networks, localized friction (Jul 2026) Port access and appointment timing, not systemic congestion
CA diesel price $6.34/gal (Jul 2026), down from $7.42 Apr peak Fuel surcharge settling lower, 15% below peak
Free time at LA/LB terminals 2-4 days (down from 5-7 pre-2020) Higher demurrage exposure per container
FMCSA non-domiciled CDL rule Active, reducing driver pool Upward pressure on base rates
CARB zero-emission mandate 100% ZEV drayage by 2035 Two-tier market: ZEV premium vs diesel competitive
Chassis availability Primary rate driver during peak season Split fees and pre-pulls more frequent
I-65 Louisville closure Expired July 31, corridor reopened Transit times normalizing on Midwest-Southeast corridor

Port Statistics, July 2026 Report

Monthly cargo throughput for the San Pedro Bay Port Complex, tracking POLA and POLB TEU data, tariff impacts on exports, empty container trends, and what it means for LA industrial real estate.

July 2026 Report

Port of Long Beach

0.93M

▼ -1.7%

Loaded Imports 467,461
Loaded Exports 104,843
Total Loaded 572,304
Total Empty 356,205
Total TEUs 928,509

Port of Los Angeles

Pending

Data not yet published

POLA July 2026 data
expected mid-to-late August
San Pedro Bay Combined
Pending

POLA data not yet available

What This Means for Industrial

The Port of Long Beach moved 928,509 TEUs in July 2026, a 1.7% decline from the same month last year but still its second-busiest July on record and the fourth-highest monthly throughput in the port’s 115-year history. The Port of Los Angeles has not yet published July figures, which are expected in the second half of August. Through the first seven months of 2026, the San Pedro Bay complex has handled 10.88 million combined TEUs, down 6.7% from the same period in 2025, with both ports seeing softer year-over-year volumes as the tariff-driven front-loading cycle that characterized 2025 continues to unwind.

POLB’s loaded imports held nearly flat at 467,461 TEUs, just 0.1% below July 2025, suggesting import demand has stabilized rather than collapsed. The broader tariff landscape shifted significantly in late July: the Section 122 global 10% surcharge terminated on July 24, but new Section 301 forced-labor duties took effect the same day, adding 10 to 12.5% on goods from 60 economies including a further 12.5% stacking on China. For industrial landlords in the South Bay and Gateway Cities, the key question is whether import volumes plateau at this level or soften further as shippers adjust to the new tariff structure.

The export story at Long Beach is a bright spot: loaded outbound TEUs surged 14.8% to 104,843, the strongest July export figure in recent years. This comes despite the complicated tariff environment for US exports, particularly Chinese retaliatory tariffs that remain on agricultural products. POLA’s year-to-date exports are up 5.4% through June, suggesting that some shippers are successfully redirecting export cargo or finding alternative Asian markets. Industrial tenants whose operations depend on export throughput should monitor whether this export momentum sustains through the fall.

Empty container movements at POLB fell 7.4% year-over-year to 356,205 TEUs in July, a modest improvement. However, POLB’s year-to-date empty ratio has risen to 38.6%, up 3.5 percentage points from 35.1% in the same period last year, indicating a persistent trade imbalance with more containers returning to Asia without US cargo. POLA, by contrast, has improved its empty ratio from 39.1% to 33.8% year-to-date, suggesting better container utilization at the LA terminals. For warehouse and distribution operators, the rising empty ratio at Long Beach signals continued import dominance and sustained demand for inbound logistics space, even as the overall volume normalizes from the 2025 peak.

The bottom line: San Pedro Bay cargo volumes are normalizing from the extraordinary 2025 tariff front-loading cycle, and the new Section 301 duties effective July 24 add another layer of uncertainty for fall import projections. Industrial tenants and landlords should watch the August and September numbers closely, as peak shipping season arrives and shippers calibrate to the revised tariff stack. POLA’s July data, when published, will complete the picture and determine whether the combined port complex is tracking toward a softer but still healthy year, or a more pronounced downturn.

2025 vs 2026 Monthly Total TEUs (San Pedro Bay Combined)

00.5M1.0M1.5M2.0M1.88M1.66MJan1.57M1.59MFeb1.60M1.53MMar1.71M1.71MApr1.36M1.68MMay1.60M1.78MJun1.96MJul1.86MAug1.68MSep1.69MOct1.60MNov1.63MDec20252026Peak Season (Jul-Oct)

12-Month Trailing TEU Data

Month POLB POLA Combined YoY
Aug 2025 901,845 958,355 1,860,200
Sep 2025 797,537 883,053 1,680,590
Oct 2025 839,673 848,424 1,688,097
Nov 2025 817,561 782,249 1,599,810
Dec 2025 834,118 791,588 1,625,706
Jan 2026 847,766 812,000 1,659,766 -11.6%
Feb 2026 767,526 824,323 1,591,849 +1.6%
Mar 2026 774,936 752,520 1,527,456 -4.3%
Apr 2026 817,993 890,861 1,708,854 -0.1%
May 2026 842,031 840,164 1,682,196 +24.1%
Jun 2026 779,331 1,002,734 1,782,065 +11.6%
Jul 2026 928,509
Peak Season (Jul-Oct)

CPI-U Index & Rent Increase Calculator

Consumer Price Index (CPI-U) data with a calculator for determining indexed rent increases. Many commercial leases tie annual escalations to CPI changes. Use the calculator below to compute the percentage increase between any two periods, then reference the historical tables for detailed index values.

CPI Rent Increase Calculator
Enter your base rent and select two CPI periods to calculate the indexed rent increase.

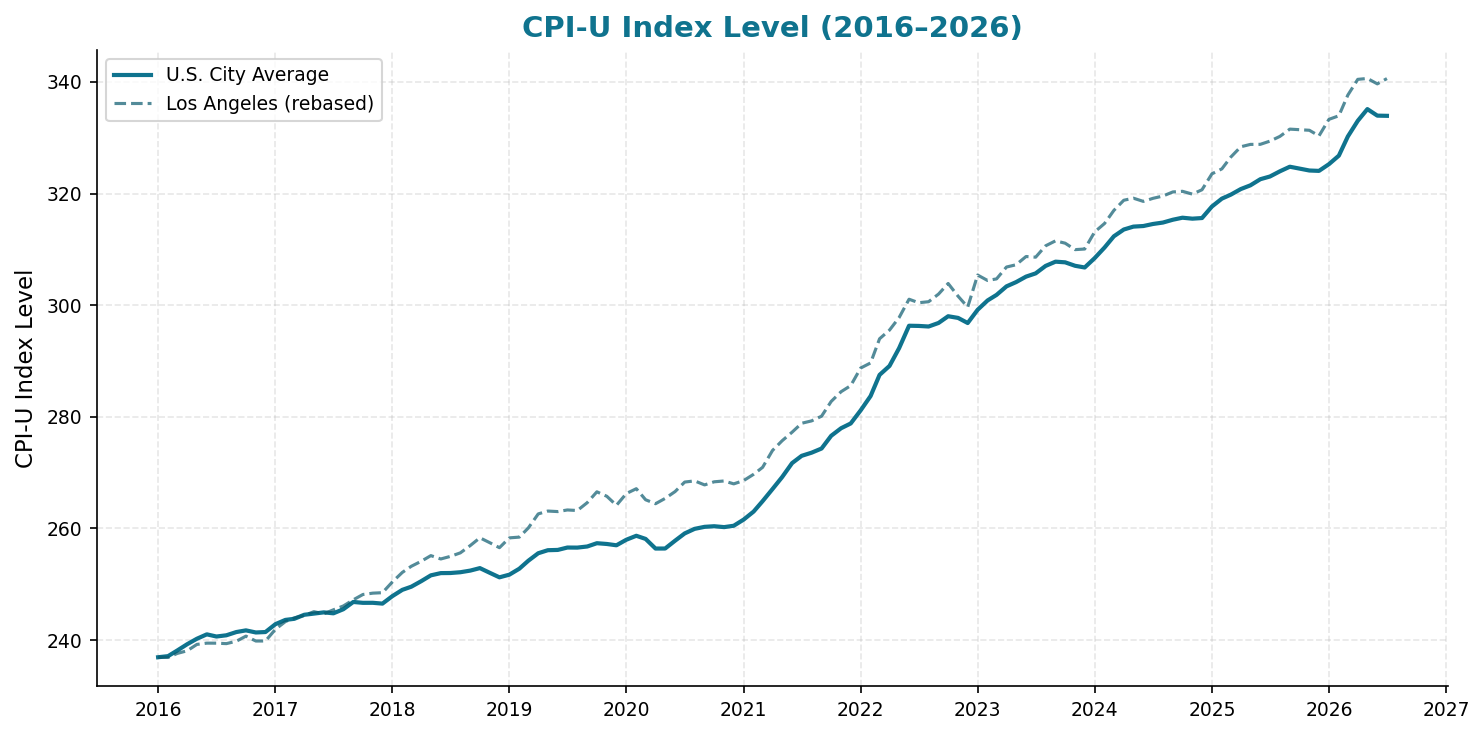
U.S. CPI-U Index Level

Consumer Price Index for All Urban Consumers, All Items. Source: U.S. Bureau of Labor Statistics.

U.S. CPI-U Index Level 2016-2026

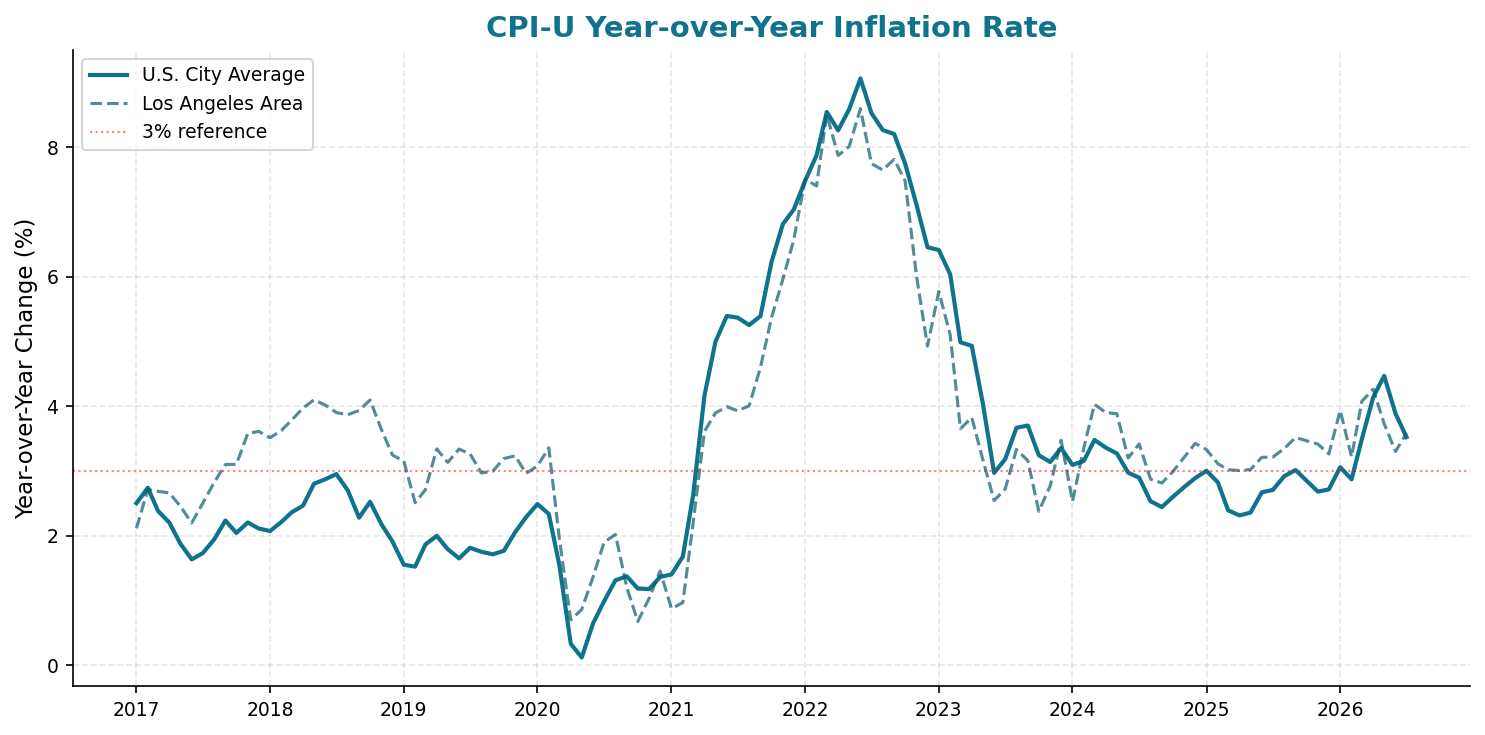
Year-over-Year Inflation Rate

Monthly year-over-year percent change in CPI-U. The 3% reference line reflects a common commercial lease escalation rate.

U.S. CPI-U Year-over-Year Inflation 2017-2026

Federal CPI-U: U.S. City Average

Series ID: CUUR0000SA0  |  Area: U.S. city average  |  Base: 1982-84=100  |  Not Seasonally Adjusted
Yr Jan Feb Mar Apr May Jun Jul Aug Sep Oct Nov Dec H1 H2 Ann
2026 325.252 326.785 330.213 333.020 335.123 333.952 333.918 330.724
2025 317.671 319.082 319.799 320.795 321.465 322.561 323.048 323.976 324.800 324.122 324.054 320.229 324 321.943
2024 308.417 310.326 312.332 313.548 314.069 314.175 314.540 314.796 315.301 315.664 315.493 315.605 312.145 315.233 313.689
2023 299.170 300.840 301.836 303.363 304.127 305.109 305.691 307.026 307.789 307.671 307.051 306.746 302.408 306.996 304.702
2022 281.148 283.716 287.504 289.109 292.296 296.311 296.276 296.171 296.808 298.012 297.711 296.797 288.347 296.963 292.655
2021 261.582 263.014 264.877 267.054 269.195 271.696 273.003 273.567 274.310 276.589 277.948 278.802 266.236 275.703 270.970
2020 257.971 258.678 258.115 256.389 256.394 257.797 259.101 259.918 260.280 260.388 260.229 260.474 257.557 260.065 258.811
2019 251.712 252.776 254.202 255.548 256.092 256.143 256.571 256.558 256.759 257.346 257.208 256.974 254.412 256.903 255.657
2018 247.867 248.991 249.554 250.546 251.588 251.989 252.006 252.146 252.439 252.885 252.038 251.233 250.089 252.125 251.107
2017 242.839 243.603 243.801 244.524 244.733 244.955 244.786 245.519 246.819 246.663 246.669 246.524 244.076 246.163 245.120
2016 236.916 237.111 238.132 239.261 240.229 241.018 240.628 240.849 241.428 241.729 241.353 241.432 238.778 241.237 240.007

X : Data unavailable due to the 2025 lapse in appropriations

Los Angeles Area CPI-U

Series ID: CUURS49AAA0  |  Area: Los Angeles-Long Beach-Anaheim, CA  |  Base: 1967=100  |  Not Seasonally Adjusted
Yr Jan Feb Mar Apr May Jun Jul Aug Sep Oct Nov Dec H1 H2 Ann
2026 1027.230 1029.213 1040.617 1049.319 1049.821 1046.833 1049.745 1040.506
2025 997.148 999.896 1006.426 1012.090 1013.404 1013.445 1015.217 1017.816 1021.839 1021.205 1018.108 1007.068 1018.837 1012.418
2024 965.040 969.743 976.949 982.566 983.700 981.930 983.616 984.889 987.147 987.499 985.952 988.352 976.655 986.243 981.449
2023 941.261 938.247 939.139 945.686 946.941 951.494 951.126 957.388 960.148 958.851 955.292 955.632 943.795 956.406 950.100
2022 889.906 892.725 906.065 910.861 917.795 927.908 925.967 926.537 930.748 936.600 929.565 923.563 907.543 928.830 918.187
2021 827.771 831.223 835.067 844.403 849.756 854.479 859.418 860.727 863.315 871.446 876.850 880.203 840.450 868.660 854.555
2020 820.612 823.275 817.166 814.991 817.913 821.692 826.946 827.588 825.370 827.088 827.545 825.943 819.275 826.747 823.011
2019 796.129 796.542 801.573 809.356 810.932 810.640 811.534 811.228 815.585 821.558 819.088 814.106 804.195 815.517 809.856
2018 771.805 777.054 780.441 783.207 786.319 784.470 785.904 787.846 791.885 796.171 793.446 790.700 780.549 790.992 785.771
2017 745.623 749.881 751.980 753.297 755.374 754.196 756.405 758.521 761.921 764.857 765.598 765.850 751.725 762.192 756.959
2016 730.207 730.081 732.326 733.789 737.292 737.989 737.973 737.723 739.038 741.855 739.156 739.171 733.614 739.153 736.383

X : Data unavailable due to the 2025 lapse in appropriations

CPI-U data sourced from the U.S. Bureau of Labor Statistics. The calculator uses monthly index values to compute the percentage change between two periods. For leases specifying semi-annual or annual average CPI, use the appropriate averaging method per your lease terms. The Federal index uses base 1982-84=100; the Los Angeles index uses base 1967=100. Calculator supports both the Federal and Los Angeles area indices.

Developers Are Back to Building U.S. Warehouses: What It Means for the South Bay

The Turn

After a two-year construction slump, U.S. warehouse development is accelerating again. More than 305 million square feet of industrial real estate was under construction nationwide in the second quarter of 2026, up 18% year-over-year and marking the second consecutive quarter of annual growth, according to Cushman & Wakefield.

Q2 leasing volume was the strongest since mid-2022, giving developers the confidence to break ground on new projects. Prologis plans $4.5 to $5.5 billion in development starts this year, up from $3.1 billion in 2025. Panattoni, based in Irvine, is ramping up starts by 62% over last year.

But the pipeline remains well below the pandemic-era peak of 725 million square feet under construction in Q3 2022. As Doug Roberts, Panattoni’s president of North American development, put it: “We’re still cautiously optimistic, but nowhere near what it was three, four years ago.”

What’s Driving the Comeback

The demand picture has shifted from the pandemic’s e-commerce surge to a more diversified set of drivers:

  • Data centers and AI infrastructure – Prologis expects 40% of its 2026 development starts to be data centers, responding to the rapid build-out of AI computing capacity nationwide.
  • Tariff-driven inventory stocking – Retailers are leasing space to warehouse goods ahead of potential tariff changes, pulling demand forward.
  • Manufacturing reshoring – Companies bringing operations into the U.S. need industrial space, supporting a structural rather than cyclical demand layer.
  • Third-party logistics growth – 3PLs are expanding to meet outsourced fulfillment needs.
  • Supply-chain diversification – As Henry Steinberg of EQT Real Estate noted, tenants are seeking to mitigate risk from port backlogs, tariffs, and natural disasters by creating more diversity in their supply chains.

What This Means for the South Bay

The national trend has specific implications for the Carson, Wilmington, and Torrance industrial corridor that we track daily:

Port-proximate markets are the first to feel the shift. The same tariff concerns driving national leasing demand are amplified here, where tenants depend on POLB and POLA throughput. We are already seeing tenants who paused renewals in 2024 and 2025 returning to the market, often with shorter decision cycles.

New construction in this market remains constrained. The South Bay lacks the large developable parcels available in Inland Empire or the Houston market. What gets built here is infill and redevelopment, not greenfield. That means existing space commands a premium when demand accelerates, and it means tenants who locked in rates in 2023 and 2024 are sitting on increasingly favorable lease positions.

Data-center demand is not a primary driver locally – yet. The South Bay’s industrial stock is weighted toward logistics, transload, and container freight operations. But the secondary effect is real: as data-center operators absorb space in Inland Empire and the High Desert, traditional logistics users get pushed toward port-proximate submarkets like ours.

The Risk Side

The development rebound is not without headwinds. The Federal Reserve has signaled potential rate hikes if inflation persists. Consumer sentiment remains near record lows. And companies pulling holiday merchandise forward to get ahead of tariff costs and Iran war-related disruptions are expected to reduce imports later in the year, which could soften near-term port-adjacent demand.

Jeremy Garner of Trammell Crow noted that coastal markets where construction had slowed are “seeing green shoots now and reasons to move forward with more development.” The question for our market is whether those green shoots translate into speculative starts or remain driven by pre-leased demand.

Bottom Line

The industrial market is turning a corner, but it is a measured turn, not a return to 2022. For South Bay tenants, the window to secure favorable lease terms is narrowing. For landlords, the pressure to fill vacant space is easing, but concessions remain available for creditworthy tenants willing to commit to longer terms.

Source: Liz Young, “Developers Are Back to Building U.S. Warehouses,” Wall Street Journal Logistics Report, July 15, 2026.

Vesperlight Real Estate Services tracks South Bay industrial market conditions daily through AIR CRE data, port statistics, and direct broker relationships. Contact us for current market intelligence specific to your submarket.

SB 415 Warehouse Standards Update: What CRE Pros Need to Know After the Industry Town Hall

California’s logistics and industrial real-estate community has entered a new phase of clarity and implementation following the passage of Senate Bill 415 (SB 415) in October 2025 — the legislative refinement to the landmark warehouse siting and design framework established in Assembly Bill 98 (AB 98) in 2024. SB 415 was devised to fix early implementation challenges that jeopardized feasibility for many logistics projects.

On November 20, 2025, industry stakeholders, local officials, developers, and land-use consultants convened at a Town Hall hosted by AIR CRE and featuring expert commentary led by Skyler Wonnacott of the California Business Properties Association (CBPA).

The discussion provided the most detailed public walkthrough yet of SB 415’s mechanics, compliance pathways, and remaining gaps — and confirmed that the law is now operational, but not yet settled in practice.


What SB 415 Fixed — Town Hall Takeaways 

The Town Hall session underscored SB 415’s role as an implementation-ready update rather than a reversal of AB 98. Key points emphasized included: 

  1. Clearer Scope with “Logistics Use Development”

SB 415 establishes a solid baseline for what qualifies as a covered logistics project: 

  • single building 
  • Primarily for warehousing/storage for distribution to business or retail customers 
  • Involving heavy-duty trucks 

The session confirmed that ancillary industrial uses — like manufacturing or agriculture (below 90 days of seasonal use) — remain excluded, avoiding overreach into unrelated industrial real-estate categories.  


  1. Thresholds & Triggers Fine-Tuned

A building enters the Warehouse Standards framework if it is 250,000+ square feet per building, not on a cumulative site basis — a key clarification for multi-building logistics parks. Office space no longer contributes to the 250,000 sf metric.  

Town Hall Q&A solidified interpretations around expansions, mezzanine additions, and what kind of improvements might or might not trigger compliance, which is critical for owners planning phased expansions or redevelopment.  


  1. Sensitive Receptor Proximity Matters

Design and mitigation requirements only kick in if a loading bay is within 900 feet of a sensitive receptor — including homes, schools, daycares, or actively used playgrounds. Passive parks alone do not count, helping reduce over-application of design restrictions in contexts where community exposure is minimal.  

This clarification gives developers confidence to pre-screen properties in early feasibility.  


  1. Buffers, Setbacks & Real-World Feasibility

The session walked through setback, screening, and noise/light mitigation requirements — but also acknowledged that strict “opposite side dock orientation” provisions from early AB 98 language were no longer enforced.

SB 415 now requires dock doors to face away from the closest sensitive receptor “to the extent feasible,” a major win for modern cross-dock logistics design 

Other elements reinforced practicality: 

  • Buffer areas may include landscaping, walkways, parking, and even public rights-of-way 
  • single truck entrance with dedicated lanes satisfies circulation requirements 
  • Anti-idling rules apply only when power capacity is sufficient for plug-in alternatives  


What the Town Hall Identified as Unresolved 

Despite broad progress, the November 20 discussion highlighted three areas still lacking legislative or regulatory closure: 

  1. Redevelopment Treatment Still a Problem: Under current law, demolition followed by rebuild is treated as new development and fully subject to Warehouse Standards. The Town Hall flagged this as a major pain point for infill redevelopment, especially in legacy industrial markets where modernization is key. Industry groups have signaled this will be a top priority in 2026 
  2. Local Implementation Variability: While SB 415 provided statewide definitions, local agencies are still building interpretation frameworks. How towns map sensitive receptors, adopt truck routes, and interpret setbacks will determine real-world feasibility in specific submarkets. The Town Hall made clear that best practices are emerging, but not uniform 
  3. Enforcement & Monitoring: SB 415 requires updated circulation elements and truck-routing plan adoption by cities and counties. However, enforcement — particularly how the Attorney General will evaluate good-faith efforts vs. noncompliance — remains unresolved. There’s also ongoing uncertainty around how environmental monitoring data (e.g., air quality metrics in industrial zones) will influence future policy evolution.  


Why This Matters to CRE Professionals 

For brokers, developers, investors, and land-use consultants, the November Town Hall did more than recap statutory language — it connected regulatory text to entitlements and asset strategy: 

✔️ Feasibility modeling is now possible: Owners can determine whether a site is subject to the Standards with confidence. 
✔️ Design pipelines are clearer: Standard metrics for setbacks, buffers, and truck circulation allow predictable cost-estimating and program planning. 
✔️ Cross-dock viability preserved: Logistically efficient layouts will no longer be prohibited by rigid orientation rules. 
✔️ Sensitive receptor mapping matters more than ever: CRE teams must integrate this into underwriting and site selection workflows.  


Looking Ahead: What’s Next 

With SB 415 now in effect and the implementation phase underway, the CRE community should be watching for: 

📌 Model ordinances and circulation element updates from cities and counties — which will define truck routing in markets statewide. 

📌 Future legislation addressing redevelopment and modernization exemptions. 

📌 Emerging enforcement guidance from state authorities that will shape how jurisdictions comply and how strictly standards are applied.