

Weekly tracking of commercial loan rates and U.S. Treasury yields. Our commercial capital markets dashboard tracks weekly commercial loan rates across major programs and U.S. Treasury yields. Data is updated weekly and aggregated over time to reveal trends in borrowing costs and the interest rate environment.
U.S. Treasury Yields
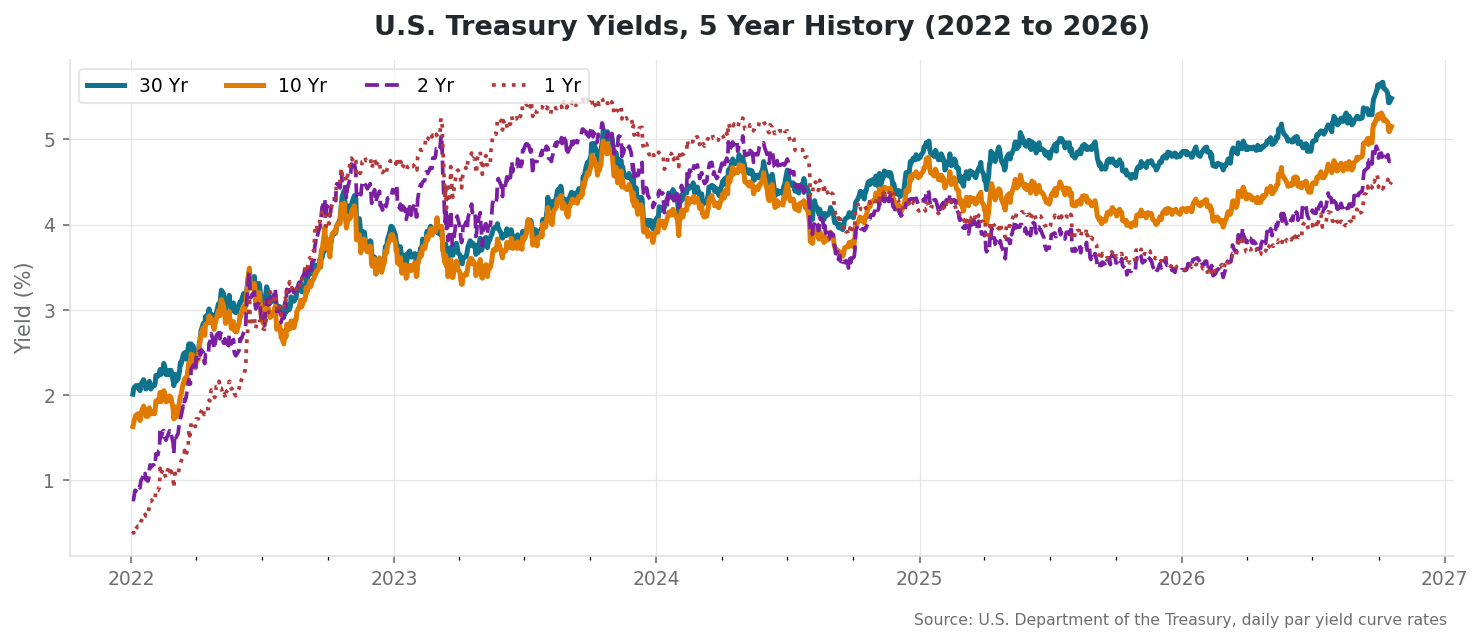
Treasury par yield curve rates for 1, 2, 10, and 30 year maturities. Source: U.S. Department of the Treasury, daily par yield curve rates. Latest data: October 19, 2026.
Trend Summary
Quarter Change (QoQ)
Year Over Year (YoY)
QoQ compares October 19, 2026 to September 30, 2026. YoY compares October 19, 2026 to October 17, 2025, the nearest prior business day (October 19, 2025 was a Sunday). Basis points (bps): 1 bp = 0.01%.
| Date | 1 Yr (%) | 2 Yr (%) | 10 Yr (%) | 30 Yr (%) |
|---|---|---|---|---|
| Oct 19, 2026 | 4.50 | 4.77 | 5.15 | 5.48 |
| Oct 09, 2026 | 4.47 | 4.80 | 5.24 | 5.60 |
| Oct 05, 2026 | 4.47 | 4.84 | 5.31 | 5.66 |
| Sep 28, 2026 | 4.59 | 4.92 | 5.24 | 5.56 |
| Sep 25, 2026 | 4.50 | 4.81 | 5.17 | 5.49 |
| Sep 18, 2026 | 4.44 | 4.76 | 5.01 | 5.34 |
Commercial Loan Rates
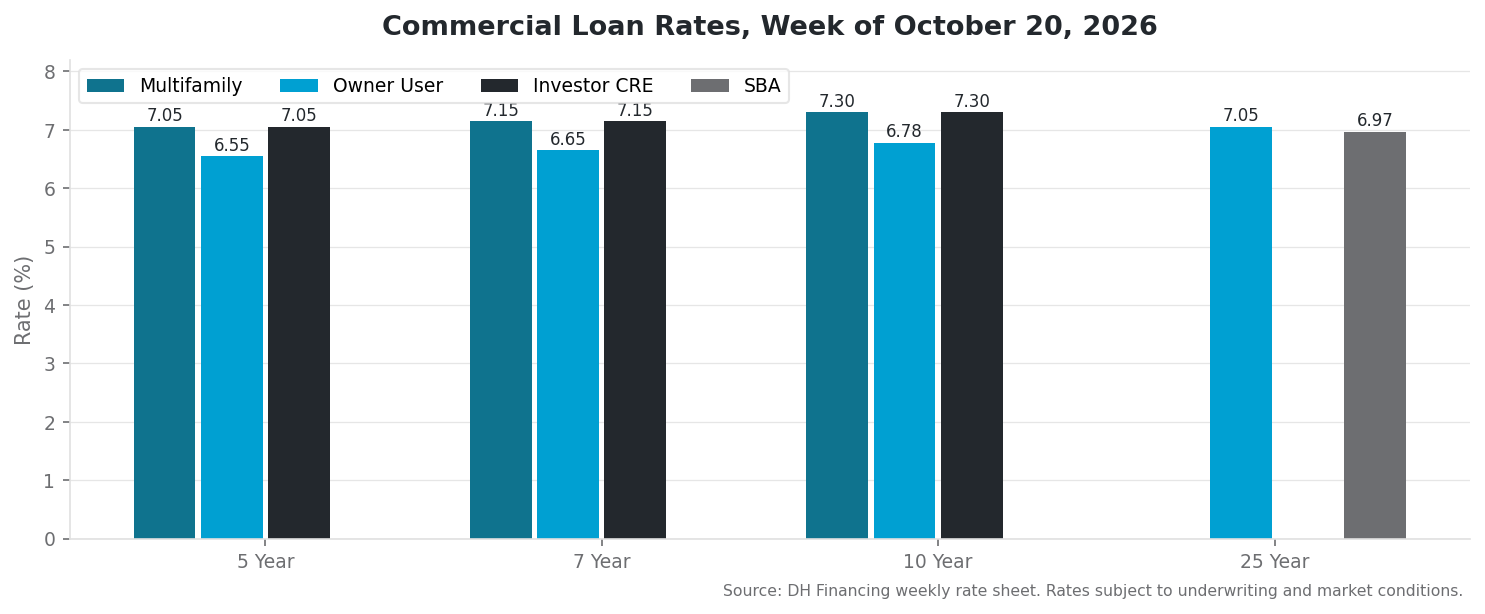
Weekly commercial capital markets rates for $1MM to $50MM loans. Source: DH Financing. Rates subject to underwriting, borrower qualifications, property type, leverage, and market conditions. Week of October 20, 2026.
Trend Summary
Month Change (Aug 4 to Oct 20)
Year over year comparison not available. DH Financing rate sheet data collection began August 4, 2026. The September 8 weekly sheet was not received, so the series runs August 4 to September 1, then September 15 onward.
| Program | 5 Year (%) | 7 Year (%) | 10 Year (%) | 25 Year (%) |
|---|---|---|---|---|
| Multifamily | 7.05 | 7.15 | 7.30 | N/A |
| Owner User | 6.55 | 6.65 | 6.78 | 7.05 |
| Investor CRE | 7.05 | 7.15 | 7.30 | N/A |
| SBA | N/A | N/A | N/A | 6.97 |
Commercial rates provided by DH Financing. Treasury yields sourced from U.S. Department of the Treasury daily par yield curve rates. Data for informational purposes only; not a commitment to lend. Updated weekly.