
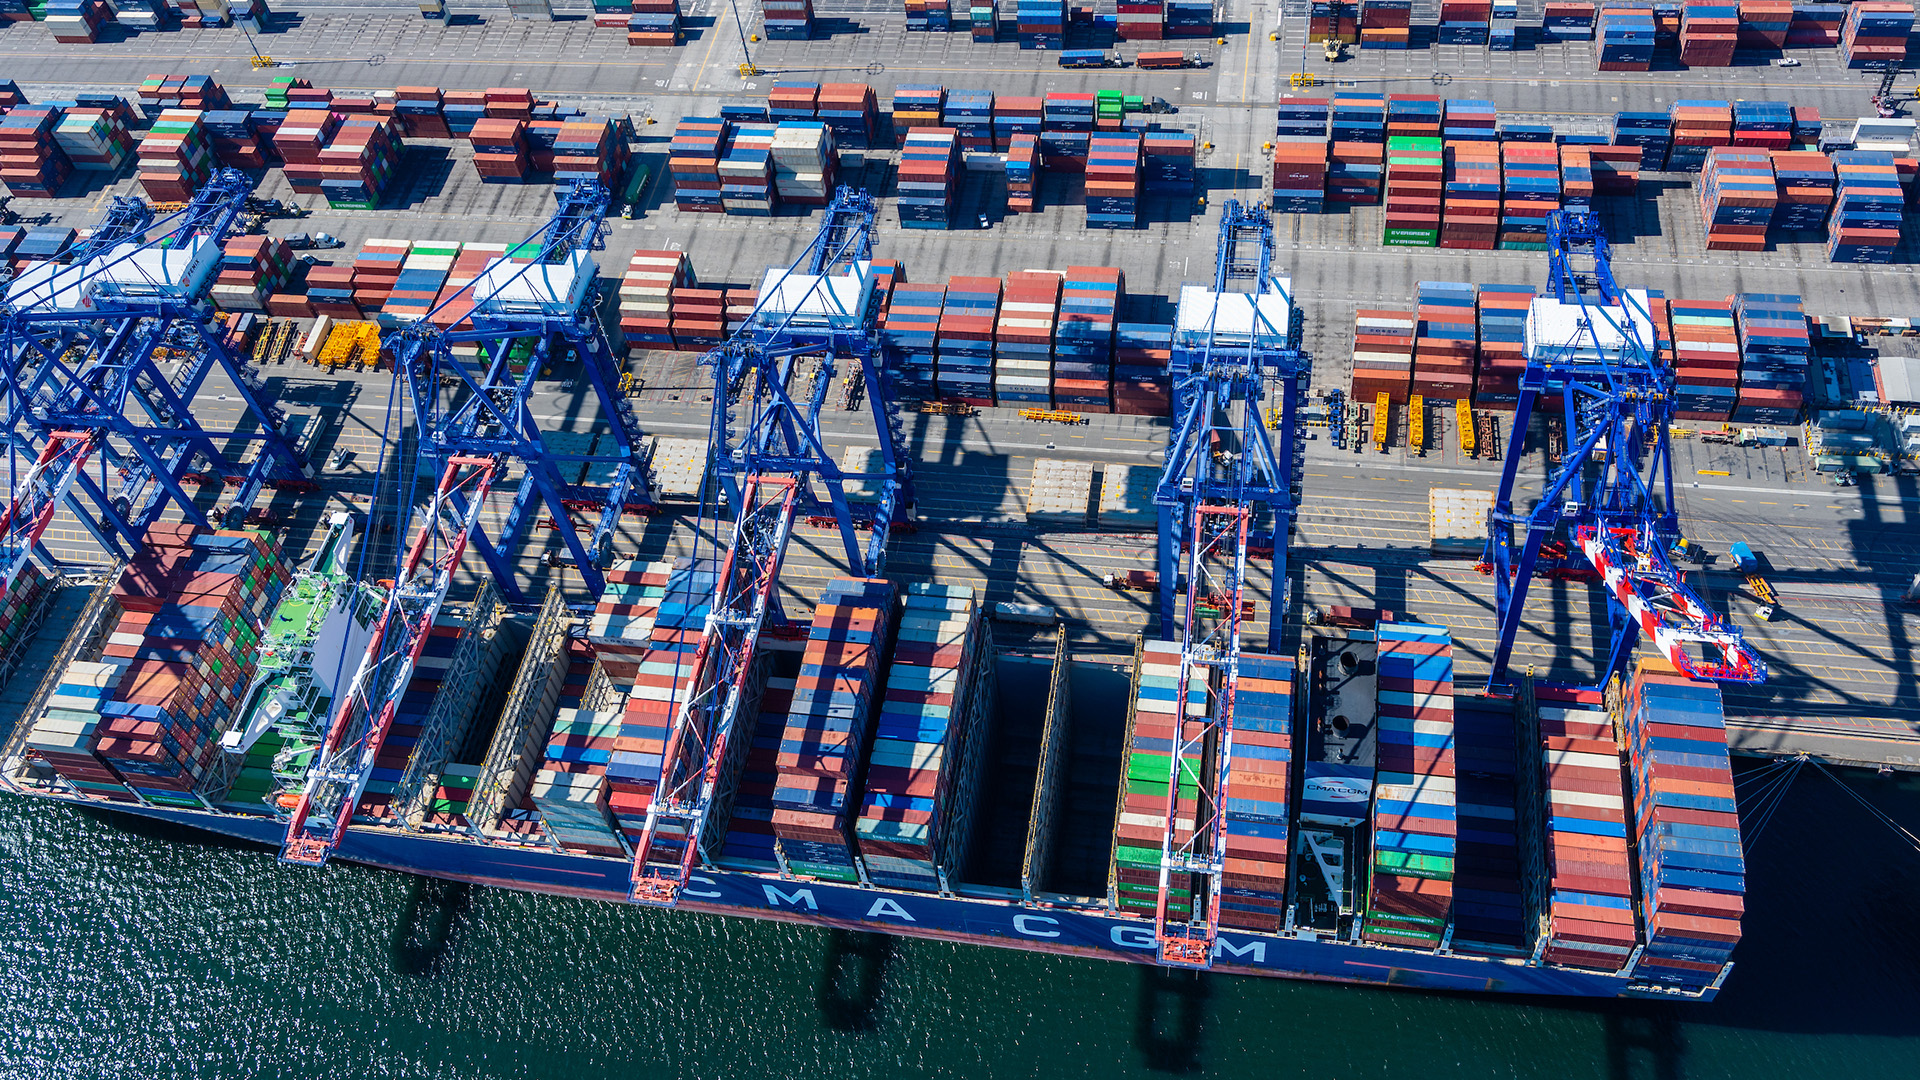
Monthly cargo throughput for the San Pedro Bay Port Complex, tracking POLA and POLB TEU data, tariff impacts on exports, empty container trends, and what it means for LA industrial real estate.
July 2026 Report
Port of Long Beach
▼ -1.7%
| Loaded Imports | 467,461 |
| Loaded Exports | 104,843 |
| Total Loaded | 572,304 |
| Total Empty | 356,205 |
| Total TEUs | 928,509 |
Port of Los Angeles
Data not yet published
| POLA July 2026 data expected mid-to-late August |
POLA data not yet available
What This Means for Industrial
The Port of Long Beach moved 928,509 TEUs in July 2026, a 1.7% decline from the same month last year but still its second-busiest July on record and the fourth-highest monthly throughput in the port’s 115-year history. The Port of Los Angeles has not yet published July figures, which are expected in the second half of August. Through the first seven months of 2026, the San Pedro Bay complex has handled 10.88 million combined TEUs, down 6.7% from the same period in 2025, with both ports seeing softer year-over-year volumes as the tariff-driven front-loading cycle that characterized 2025 continues to unwind.
POLB’s loaded imports held nearly flat at 467,461 TEUs, just 0.1% below July 2025, suggesting import demand has stabilized rather than collapsed. The broader tariff landscape shifted significantly in late July: the Section 122 global 10% surcharge terminated on July 24, but new Section 301 forced-labor duties took effect the same day, adding 10 to 12.5% on goods from 60 economies including a further 12.5% stacking on China. For industrial landlords in the South Bay and Gateway Cities, the key question is whether import volumes plateau at this level or soften further as shippers adjust to the new tariff structure.
The export story at Long Beach is a bright spot: loaded outbound TEUs surged 14.8% to 104,843, the strongest July export figure in recent years. This comes despite the complicated tariff environment for US exports, particularly Chinese retaliatory tariffs that remain on agricultural products. POLA’s year-to-date exports are up 5.4% through June, suggesting that some shippers are successfully redirecting export cargo or finding alternative Asian markets. Industrial tenants whose operations depend on export throughput should monitor whether this export momentum sustains through the fall.
Empty container movements at POLB fell 7.4% year-over-year to 356,205 TEUs in July, a modest improvement. However, POLB’s year-to-date empty ratio has risen to 38.6%, up 3.5 percentage points from 35.1% in the same period last year, indicating a persistent trade imbalance with more containers returning to Asia without US cargo. POLA, by contrast, has improved its empty ratio from 39.1% to 33.8% year-to-date, suggesting better container utilization at the LA terminals. For warehouse and distribution operators, the rising empty ratio at Long Beach signals continued import dominance and sustained demand for inbound logistics space, even as the overall volume normalizes from the 2025 peak.
The bottom line: San Pedro Bay cargo volumes are normalizing from the extraordinary 2025 tariff front-loading cycle, and the new Section 301 duties effective July 24 add another layer of uncertainty for fall import projections. Industrial tenants and landlords should watch the August and September numbers closely, as peak shipping season arrives and shippers calibrate to the revised tariff stack. POLA’s July data, when published, will complete the picture and determine whether the combined port complex is tracking toward a softer but still healthy year, or a more pronounced downturn.
2025 vs 2026 Monthly Total TEUs (San Pedro Bay Combined)
12-Month Trailing TEU Data
| Month | POLB | POLA | Combined | YoY |
|---|---|---|---|---|
| Aug 2025 | 901,845 | 958,355 | 1,860,200 | – |
| Sep 2025 | 797,537 | 883,053 | 1,680,590 | – |
| Oct 2025 | 839,673 | 848,424 | 1,688,097 | – |
| Nov 2025 | 817,561 | 782,249 | 1,599,810 | – |
| Dec 2025 | 834,118 | 791,588 | 1,625,706 | – |
| Jan 2026 | 847,766 | 812,000 | 1,659,766 | -11.6% |
| Feb 2026 | 767,526 | 824,323 | 1,591,849 | +1.6% |
| Mar 2026 | 774,936 | 752,520 | 1,527,456 | -4.3% |
| Apr 2026 | 817,993 | 890,861 | 1,708,854 | -0.1% |
| May 2026 | 842,031 | 840,164 | 1,682,196 | +24.1% |
| Jun 2026 | 779,331 | 1,002,734 | 1,782,065 | +11.6% |
| Jul 2026 | 928,509 | – | – | – |