
Monthly cargo throughput for the San Pedro Bay Port Complex, tracking POLA and POLB TEU data, tariff impacts on exports, empty container trends, and what it means for LA industrial real estate.
August 2026 Report
Port of Long Beach
▲ +2.0%
| Loaded Imports | 456,100 |
| Loaded Exports | 99,754 |
| Total Loaded | 555,854 |
| Total Empty | 364,138 |
| Total TEUs | 919,992 |
Port of Los Angeles
▼ -0.3%
| Loaded Imports | 500,302 |
| Loaded Exports | 115,561 |
| Total Loaded | 615,863 |
| Total Empty | 340,044 |
| Total TEUs | 955,907 |
▲ +0.8% Year-over-Year
What This Means for Industrial
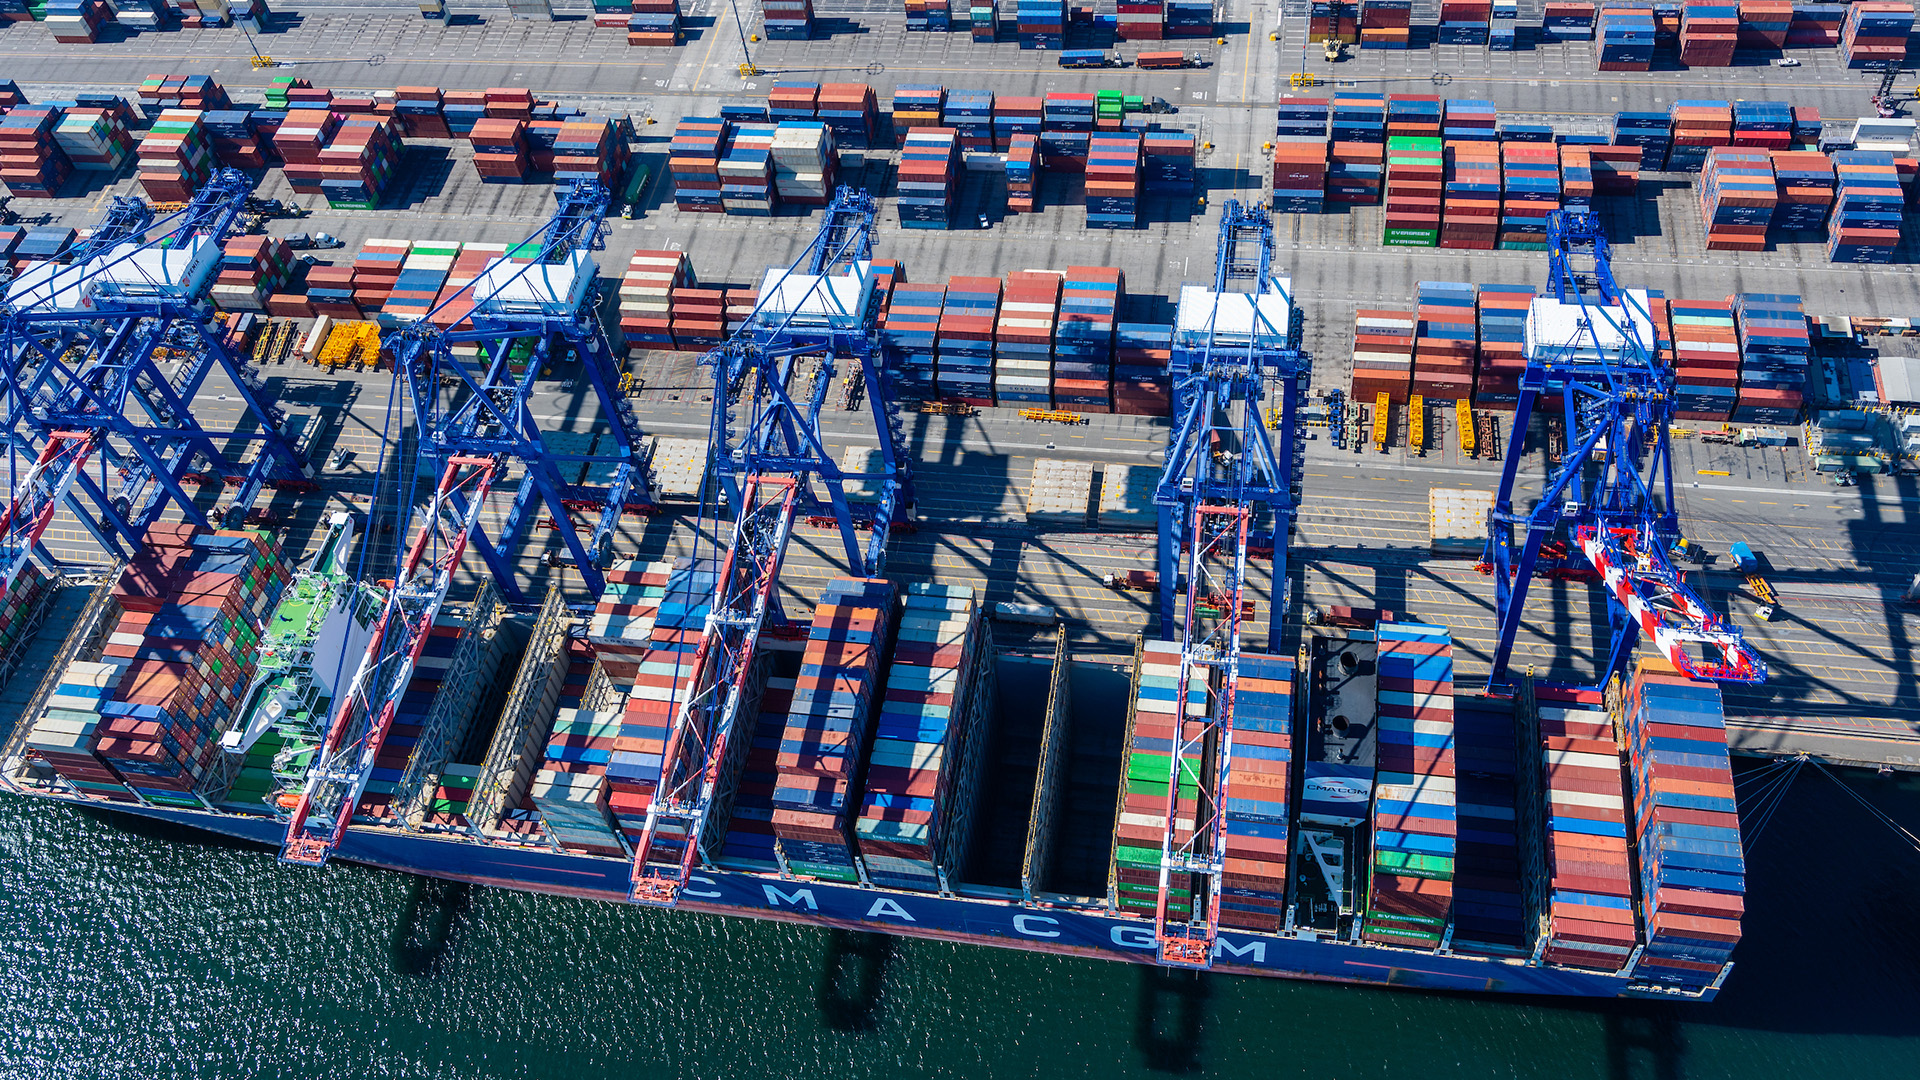
The San Pedro Bay port complex moved 1,875,899 TEUs in August, up 0.8% over the same month last year, with both gateways holding strong through the back half of peak season. Long Beach handled 919,992 TEUs, up 2.0% and its best August on record, while also marking the fifth-busiest month in its 115-year history. Los Angeles processed 955,907 TEUs, down just 0.3% from last year, capping the busiest three-month stretch in that port’s history with more than 2.9 million TEUs moved across June, July and August. After a first half shaped by tariff timing shifts, the two ports are converging on the same healthy baseline: combined year-to-date volume of 13.72 million TEUs, up 1.4%.
Import demand stayed resilient deep into peak season. Long Beach loaded imports rose 3.6% to 456,100 TEUs, while Los Angeles took in 500,302 TEUs, essentially flat with last August and 7% above its five-year average for the month. Long Beach CEO Noel Hacegaba credited shippers who “sent their cargo ahead of a July 24 tariff expiration date,” hedging against the new Section 301 forced-labor duties that took effect the same day on goods from 60 economies. The National Retail Federation now expects September to be the busiest import month of the year at major US ports, a sharp reversal from its earlier call for a fall slowdown. For industrial landlords, the open question is how much of this strength is genuine consumer demand versus cargo pulled forward ahead of tariff changes, a distinction that matters for underwriting fourth-quarter warehouse demand.
The export story flipped this month. Long Beach loaded exports climbed 4.0% to 99,754 TEUs and are up 10.3% year-to-date, extending the surge that produced a 14.8% jump in July. Los Angeles exports fell 9.3% to 115,561 TEUs, leaving its year-to-date outbound count down 2.8%. The divergence matters for industrial tenants whose operations depend on outbound cargo: Long Beach-adjacent corridors along the 710 are seeing the stronger export activity, while Los Angeles-side outbound volumes have softened even as its import operation runs at record pace.
Empty container movements, the cleanest read on the trade imbalance, improved at Long Beach and built modestly at Los Angeles. Long Beach empties slipped 0.4% to 364,138 TEUs, and its year-to-date empty ratio has improved to 38.7% from 40.2% at the same point last year. Los Angeles empties rose 4.2% to 340,044 TEUs, with its empty ratio holding near 34% year-to-date. Roughly one of every three container moves through the complex is still an empty repositioned toward Asia, a structural signature of import-heavy flows. For warehouse and distribution operators in the South Bay, Gateway Cities and Harbor Gateway, that imbalance remains the backdrop that keeps inbound logistics space in demand even in flat months.
The bottom line: peak season is running later and stronger than forecast, and the San Pedro Bay complex enters September with real momentum. Los Angeles expects to exceed 900,000 TEUs this month, and the NRF projects the busiest import month of the year across major US ports. Watch the September print for whether the extended peak holds or the tariff pull-forward finally exhausts itself. Either way, port-adjacent industrial demand has stayed firmer than early-summer forecasts anticipated, and vacancy in the South Bay, Gateway Cities and Harbor Gateway should continue to feel that support into the fourth quarter.
2025 vs 2026 Monthly Total TEUs (San Pedro Bay Combined)
12-Month Trailing TEU Data
| Month | POLB | POLA | Combined | YoY |
|---|---|---|---|---|
| Sep 2025 | 797,537 | 883,053 | 1,680,590 | -5.8% |
| Oct 2025 | 839,673 | 848,424 | 1,688,097 | -10.8% |
| Nov 2025 | 817,561 | 782,249 | 1,599,810 | -9.5% |
| Dec 2025 | 834,118 | 791,588 | 1,625,706 | -8.8% |
| Jan 2026 | 847,766 | 812,000 | 1,659,766 | -11.6% |
| Feb 2026 | 767,526 | 824,323 | 1,591,849 | +1.6% |
| Mar 2026 | 774,936 | 752,520 | 1,527,456 | -4.3% |
| Apr 2026 | 817,993 | 890,861 | 1,708,854 | -0.1% |
| May 2026 | 842,031 | 840,164 | 1,682,196 | +24.1% |
| Jun 2026 | 779,331 | 1,002,734 | 1,782,065 | +11.6% |
| Jul 2026 | 928,509 | 960,464 | 1,888,973 | -3.8% |
| Aug 2026 | 919,992 | 955,907 | 1,875,899 | +0.8% |