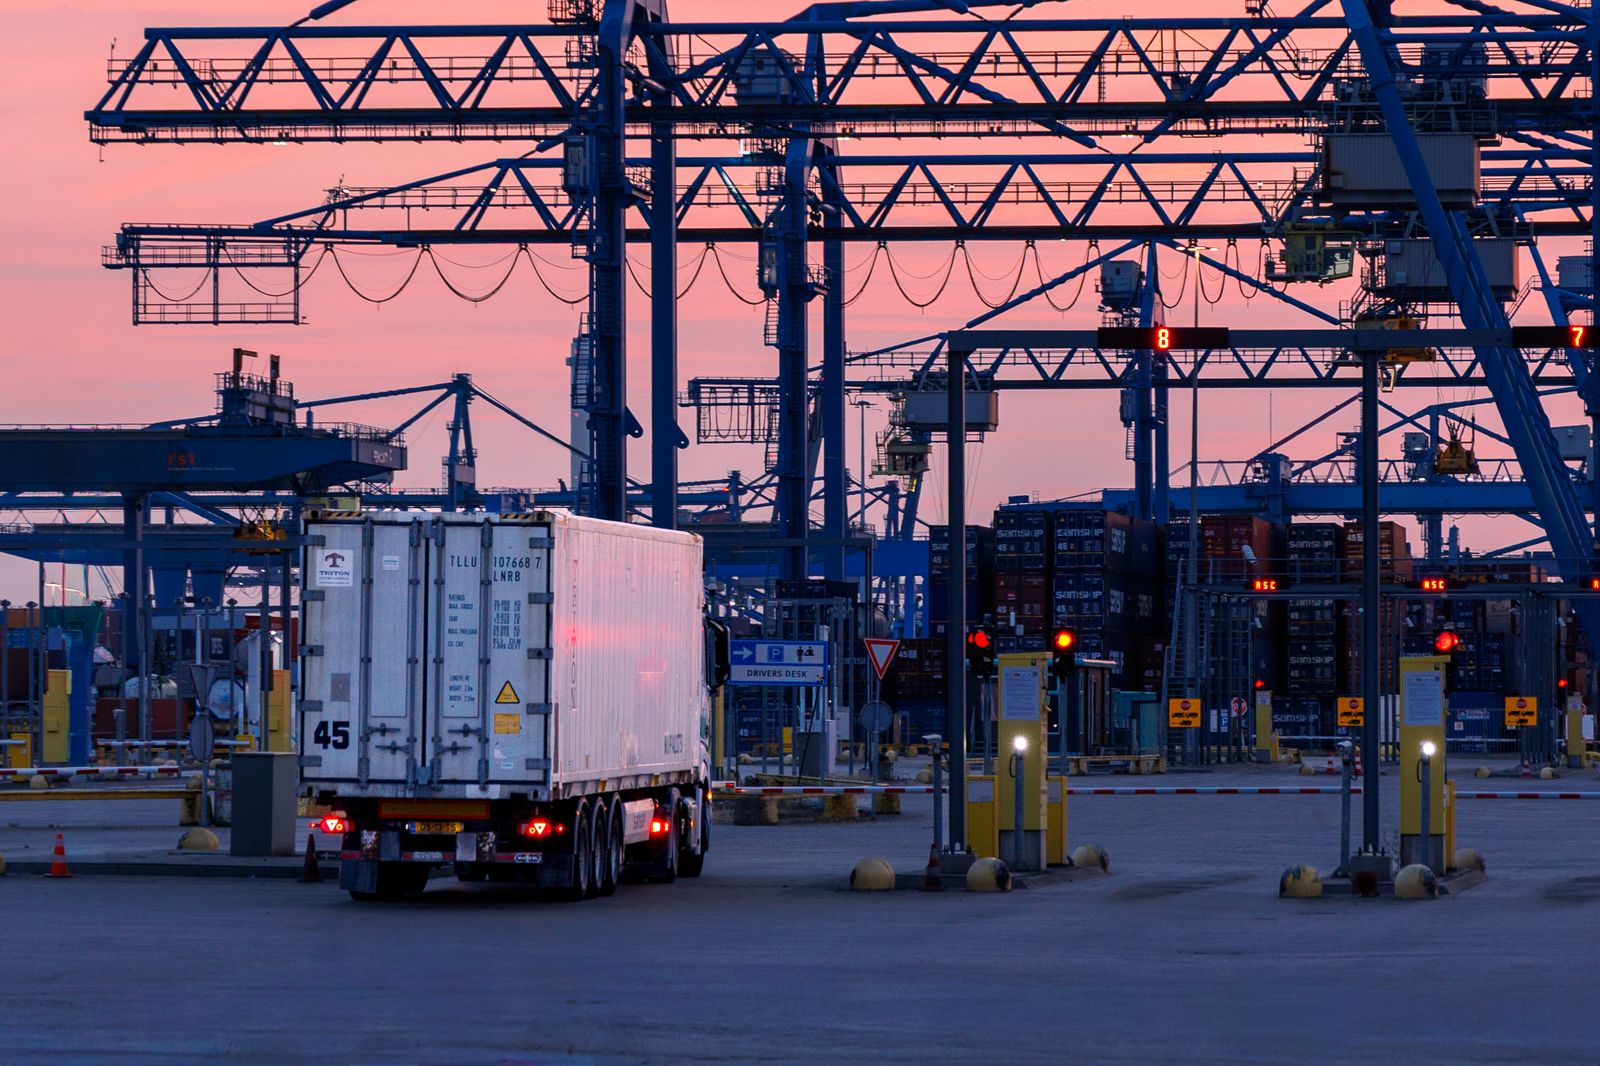
Drayage rates and cost trends for the San Pedro Bay Port Complex, tracking base rates, fuel surcharges, chassis fees, and the full fee stack that drives landed cost for LA industrial real estate.
Base Drayage Rate
40′ dry container, local move, port to warehouse within 25 miles
$285 - $420 per move
+4% YoY
|
LOW |
HIGH |
AVG |
| 20′ Container |
$275 |
$425 |
$350 |
| 40′ Container |
$325 |
$525 |
$425 |
| All-In (40′) |
$525 |
$925 |
$725 |
Fuel Surcharge
Percentage of base rate, tracks EIA CA diesel index monthly
22 - 30%
CA Diesel +41% Feb-Aug 2026
|
RATE |
BASIS |
|
| PierPass / TMF |
$35 |
per TEU |
|
| Clean Truck Fund |
$10 |
per TEU |
|
| Chassis Split |
$35-$55 |
per move |
|
| Port Congestion |
$50-$150 |
per move |
|
All-In Cost per 40′ Container
$525 - $925 base + fuel + chassis + fees
LA/LB rates run 20-35% above national average
What This Means for Industrial
Drayage is the connective tissue between port throughput and warehouse demand. When rates spike, it signals congestion at the terminals, chassis shortages, or fuel pressure, all of which ripple into industrial real estate decisions. Importers facing higher drayage costs tend to pull distribution closer to the ports or seek inland sites with rail access to bypass trucking entirely.
The CA diesel spike from $4.87/gal in February to $7.42/gal in April 2026 drove fuel surcharges from the low end of the range toward the high end, pushing all-in costs from roughly $600 to $850 per move. The summer moderation stalled in August: diesel rebounded to $6.88/gal, up 8.5% from July and 41% above February, while WTI firmed to $83.90/bbl. Fuel surcharges are drifting back toward the upper half of the 22-30% range, and all-in costs have moved back toward $750 per move. At 5,000 containers per year, the residual fuel premium still represents roughly $500K in additional landed cost annually compared to pre-spike levels.
C.H. Robinson’s September 2026 Edge Report characterizes major U.S. gateways as broadly stable, with performance differences driven by inland constraints rather than port operations: a container can clear its vessel on schedule and then lose time waiting for a chassis, rail departure, or terminal handoff. The National Drayage Spot Market Index is up 8.2% year over year as peak-season container flows compete for tightening trucking capacity, and strong trans-Pacific demand is expected to keep container activity elevated at Southern California gateways through China’s Golden Week. For industrial tenants, the August diesel rebound is a reminder that fuel relief is fragile, and the structural cost floor from CARB zero-emission mandates and chassis availability constraints means proximity to the San Pedro Bay complex remains a premium worth pricing into lease decisions.
Fee Stack: Anatomy of a Drayage Invoice
| Line Item |
Typical Charge |
What It Covers |
| Base Drayage |
$425 |
Single move: terminal to warehouse, return empty |
| Fuel Surcharge (25%) |
$106 |
Adjusts weekly with EIA diesel index |
| Chassis Usage (3 days) |
$120 |
Pool chassis rental, first day often included |
| PierPass / Clean Truck |
$45 |
Off-peak entry fee + emissions program |
| TMF / Gate Move |
$35 |
Terminal handling fee per gate transaction |
| Pre-Pull (optional) |
$125 |
Pull from terminal early to avoid demurrage |
| Subtotal (no exceptions) |
$731 - $856 |
Routine import to local warehouse |
| Driver Wait (after free hr) |
$75-$125/hr |
Detention at shipper or receiver |
| Demurrage (per day) |
$150-$350 |
Container left at terminal past free time |
| Per Diem (chassis/container) |
$75-$200/day |
Equipment held past free days |
CA Diesel vs WTI: Fuel Cost Driver
| Month |
CA Diesel ($/gal) |
WTI ($/bbl) |
Drayage Impact |
| Mar 2026 |
$6.32 |
$91.38 |
Surcharge spike begins |
| Apr 2026 |
$7.42 |
$100.32 |
Peak surcharge pressure |
| May 2026 |
$7.27 |
$102.13 |
Sustained high surcharge |
| Jun 2026 |
$6.67 |
$84.81 |
Moderating, still elevated |
| Jul 2026 |
$6.34 |
$80.46 |
Moderation, 15% below peak |
| Aug 2026 |
$6.88 |
$83.90 |
Diesel rebound reverses moderation |
National Port Comparison: 40′ Local Drayage (Q1 2026)
| Port / Metro |
Base Rate |
All-In |
vs LA/LB |
| Los Angeles / Long Beach |
$325-$525 |
$525-$925 |
Baseline (highest US) |
| Oakland |
$350-$550 |
$575-$925 |
+2% to +6% |
| New York / New Jersey |
$350-$525 |
$550-$900 |
-3% to -3% |
| Seattle / Tacoma |
$325-$500 |
$525-$875 |
-4% to -5% |
| Miami / Port Everglades |
$325-$500 |
$525-$850 |
-3% to -8% |
| Norfolk / Virginia |
$300-$475 |
$475-$800 |
-9% to -13% |
| Savannah |
$275-$425 |
$425-$725 |
-19% to -22% |
| Houston |
$275-$450 |
$425-$750 |
-19% to -19% |
| Charleston |
$275-$450 |
$425-$750 |
-19% to -19% |
Market Context: Drivers and Pressures
| Factor |
Status (Sep 2026) |
Rate Impact |
| National Drayage Spot Index |
+8.2% YoY |
Peak-season capacity tightening sustains elevated rates |
| Market stability |
Stable gateways, inland handoff friction (Sep 2026) |
Delay risk shifts from berth to chassis and rail handoffs |
| CA diesel price |
$6.88/gal (Aug 2026), +8.5% MoM rebound |
Surcharges drifting back toward upper half of range |
| Free time at LA/LB terminals |
2-4 days (down from 5-7 pre-2020) |
Higher demurrage exposure per container |
| FMCSA non-domiciled CDL rule |
Active, reducing driver pool |
Upward pressure on base rates |
| CARB zero-emission mandate |
100% ZEV drayage by 2035 |
Two-tier market: ZEV premium vs diesel competitive |
| Chassis availability |
Primary rate driver during peak season |
Split fees and pre-pulls more frequent |
| Peak-season trans-Pacific demand |
Elevated through China’s Golden Week |
Sustains container activity at SoCal gateways |