
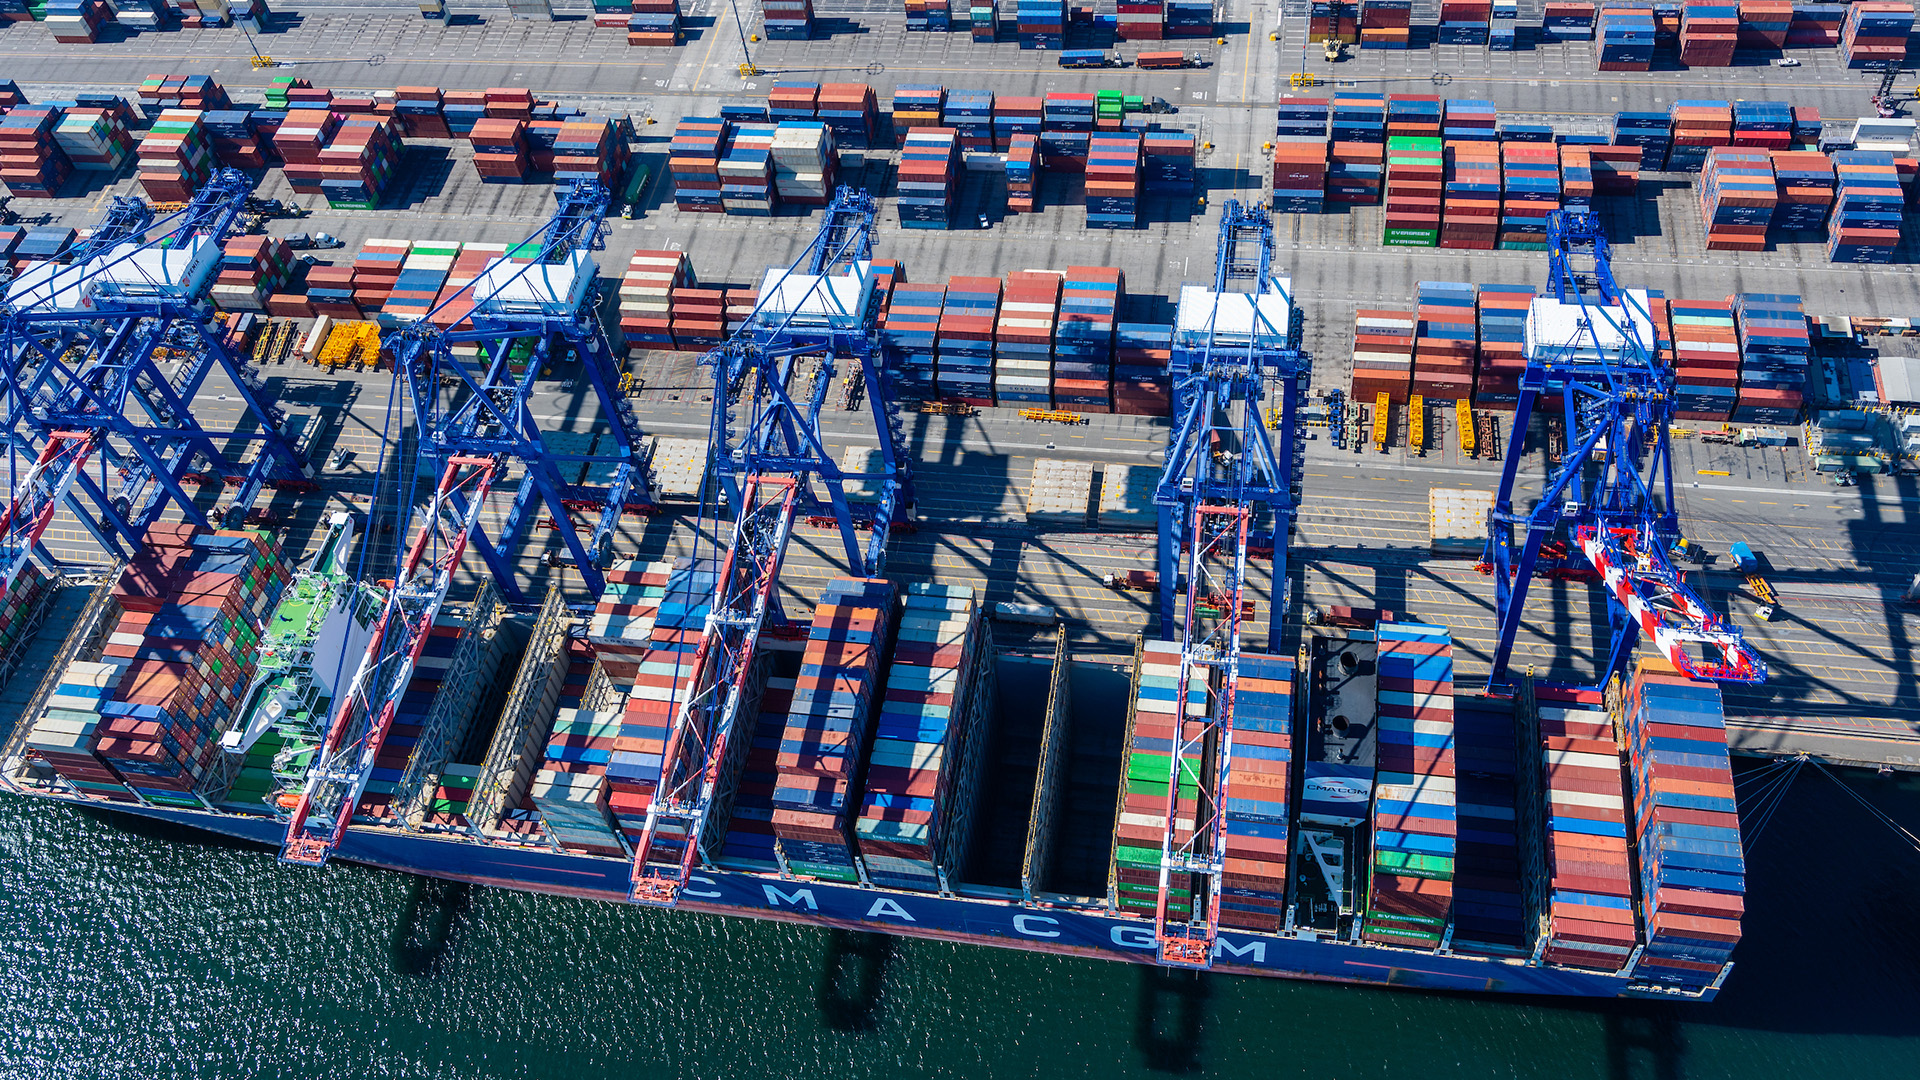
Monthly cargo throughput for the San Pedro Bay Port Complex, tracking POLA and POLB TEU data, tariff impacts on exports, empty container trends, and what it means for LA industrial real estate.
June 2026 Report
Port of Los Angeles
▲ +12.4% Year-over-Year
| Metric | June 2026 | June 2025 |
|---|---|---|
| Loaded Imports | 530,558 | 470,450 |
| Loaded Exports | 126,365 | 126,144 |
| Total Loaded | 656,923 | 596,594 |
| Total Empty | 345,811 | 295,746 |
| Total TEUs | 1,002,734 | 892,340 |
Port of Long Beach
▲ +10.6% Year-over-Year
| Metric | June 2026 | June 2025 |
|---|---|---|
| Loaded Imports | 387,025 | 348,681 |
| Loaded Exports | 86,446 | 87,627 |
| Total Loaded | 473,471 | 436,308 |
| Total Empty | 305,860 | 268,095 |
| Total TEUs | 779,331 | 704,403 |
What This Means for Industrial
The San Pedro Bay port complex moved 1.78 million TEUs in June, an 11.6% increase over the same month last year. The headline number is driven almost entirely by the Port of Los Angeles, which crossed the 1 million TEU mark for only the third time in its history. POLA surged 12.4% year-over-year to 1,002,734 TEUs while POLB gained a more modest 10.6% to 779,331. The divergence is stark: POLA captured 56% of combined throughput, continuing a share-shift trend that has defined the first half of 2026.
The import surge is textbook tariff front-loading. With the 10% Section 122 universal import surcharge set to expire July 24, retailers and manufacturers accelerated shipments to beat the deadline. POLA Executive Director Gene Seroka confirmed that businesses are “moving cargo whenever conditions are favorable rather than following traditional seasonal shipping patterns.” Loaded imports at POLA hit 530,558 TEUs, the port’s third-highest import month on record. For industrial landlords in the South Bay and Harbor Gateway, this means continued strong demand for inbound logistics space, but the question is whether July and August will see a cliff as the tariff deadline passes.
On the export side, the picture is more nuanced. POLA loaded exports held flat at 126,365 TEUs compared to 126,144 last June, a remarkable stabilization after months of volatility. POLB exports dipped slightly to 86,446, down 1.3% year-over-year. The year-to-date trend still favors POLA: outbound traffic is up 28.5% through six months at Los Angeles while Long Beach exports are up 10.7%. The export resilience at POLA suggests some shippers are consolidating outbound flows through LA terminals to maintain sailings, a trend with implications for export-facing tenants in the Gateway Cities submarket.
Empty containers tell a divergent story. POLA empties rose 17% in June to 345,811 TEUs as equipment returned to Asia to support continued import demand. POLB empties increased 14% to 305,860. Year-to-date, POLB’s empty ratio sits at 38.6% versus POLA’s 33.8%. The widening gap in empty ratios reflects the structural trade imbalance: more containers returning empty to Asia means import dominance continues. For warehouse and distribution operators, this signals sustained demand for inbound handling space, but also mounting pressure on export capacity. The rising empty flow at both ports suggests that even with tariff changes, the fundamental import-heavy trade pattern persists.
The bottom line: June’s record-breaking numbers are a tariff-driven surge that may not sustain through the back half of 2026. Industrial tenants and landlords should watch July and August volumes closely for signs of a post-deadline pullback. If imports normalize after July 24, the second half could see softer demand for port-adjacent warehouse space. But with POLA’s fiscal year closing at 10.4 million TEUs and year-to-date combined volume up 2.6%, the underlying demand foundation remains solid. The key variable is whether the Section 122 expiration brings relief or triggers a new round of trade policy uncertainty.
Monthly TEU Comparison: 2025 vs 2026
| Month | POLA | POLB | Combined | YoY % |
|---|---|---|---|---|
| Jul 2025 | 1,019,836 | 944,233 | 1,964,070 | +7.8% |
| Aug 2025 | 901,845 | 958,355 | 1,860,200 | -0.8% |
| Sep 2025 | 797,537 | 883,053 | 1,680,590 | -5.8% |
| Oct 2025 | 839,673 | 848,424 | 1,688,097 | -10.8% |
| Nov 2025 | 817,561 | 782,249 | 1,599,810 | -9.5% |
| Dec 2025 | 834,118 | 791,588 | 1,625,706 | -8.8% |
| Jan 2026 | 812,000 | 847,766 | 1,659,766 | -11.6% |
| Feb 2026 | 824,323 | 767,526 | 1,591,849 | +1.6% |
| Mar 2026 | 752,520 | 774,936 | 1,527,456 | -4.3% |
| Apr 2026 | 890,861 | 817,993 | 1,708,854 | -0.1% |
| May 2026 | 840,164 | 842,031 | 1,682,196 | +24.1% |
| Jun 2026 | 1,002,734 | 779,331 | 1,782,065 | +11.6% |
Prior month data published mid-month. Last Updated: July 16, 2026.