

Every industrial listing that enters the broker marketplace is an owner deciding to monetize now. A listing the marketplace later records as Leased or Sold is a tenant or buyer committing. This page tracks both sides of that flow, new arrivals, reported deals, and the net between them, on a rolling 12 week window, 08/17/2026 through 11/02/2026. Our research system updates it weekly from AIR CRE marketplace listings.
| Week | LA South | MidCounties | LA Central | ||||||
| Props / SF | Arrivals | Deals | Net | Arrivals | Deals | Net | Arrivals | Deals | Net |
| 08/17/2026 | 7 / 811,793 | 7 / 509,735 | 0 / +302,058 | 13 / 383,524 | 6 / 294,099 | +7 / +89,425 | 17 / 270,400 | 11 / 294,815 | +6 / -24,415 |
| 08/24/2026 | 13 / 315,180 | 8 / 349,850 | +5 / -34,670 | 3 / 37,626 | 2 / 109,421 | +1 / -71,795 | 21 / 651,559 | 5 / 486,859 | +16 / +164,700 |
| 08/31/2026 | 18 / 385,340 | 4 / 92,537 | +14 / +292,803 | 4 / 206,435 | 7 / 306,719 | -3 / -100,284 | 14 / 278,871 | 7 / 69,749 | +7 / +209,122 |
| 09/07/2026 | 15 / 491,851 | 4 / 154,385 | +11 / +337,466 | 5 / 59,457 | 3 / 340,725 | +2 / -281,268 | 13 / 536,903 | 4 / 125,339 | +9 / +411,564 |
| 09/14/2026 | 17 / 918,029 | 18 / 996,505 | -1 / -78,476 | 8 / 129,711 | 5 / 202,203 | +3 / -72,492 | 20 / 438,492 | 12 / 286,299 | +8 / +152,193 |
| 09/21/2026 | 22 / 792,955 | 7 / 394,836 | +15 / +398,119 | 6 / 389,224 | 2 / 57,608 | +4 / +331,616 | 28 / 979,405 | 9 / 629,591 | +19 / +349,814 |
| 09/28/2026 | 6 / 153,621 | 3 / 37,317 | +3 / +116,304 | 14 / 238,261 | 4 / 163,182 | +10 / +75,079 | 14 / 454,939 | 6 / 150,018 | +8 / +304,921 |
| 10/05/2026 | 18 / 402,057 | 7 / 177,335 | +11 / +224,722 | 11 / 367,564 | 3 / 278,927 | +8 / +88,637 | 16 / 542,481 | 5 / 136,449 | +11 / +406,032 |
| 10/12/2026 | 13 / 926,169 | 5 / 215,038 | +8 / +711,131 | 12 / 354,259 | 2 / 124,450 | +10 / +229,809 | 19 / 790,632 | 3 / 167,858 | +16 / +622,774 |
| 10/19/2026 | 12 / 1,485,470 | 10 / 498,560 | +2 / +986,910 | 7 / 35,507 | 4 / 144,387 | +3 / -108,880 | 24 / 909,800 | 4 / 74,950 | +20 / +834,850 |
| 10/26/2026 | 9 / 647,412 | 10 / 822,261 | -1 / -174,849 | 8 / 202,496 | 4 / 24,333 | +4 / +178,163 | 27 / 1,051,897 | 6 / 86,329 | +21 / +965,568 |
| 11/02/2026 | 10 / 144,554 | 7 / 454,760 | +3 / -310,206 | 8 / 134,493 | 5 / 149,668 | +3 / -15,175 | 14 / 1,286,204 | 3 / 58,526 | +11 / +1,227,678 |
| Rolling 12 Week Total | 160 / 7,474,431 | 90 / 4,703,119 | +70 / +2,771,312 | 99 / 2,538,557 | 47 / 2,195,722 | +52 / +342,835 | 227 / 8,191,583 | 75 / 2,566,782 | +152 / +5,624,801 |
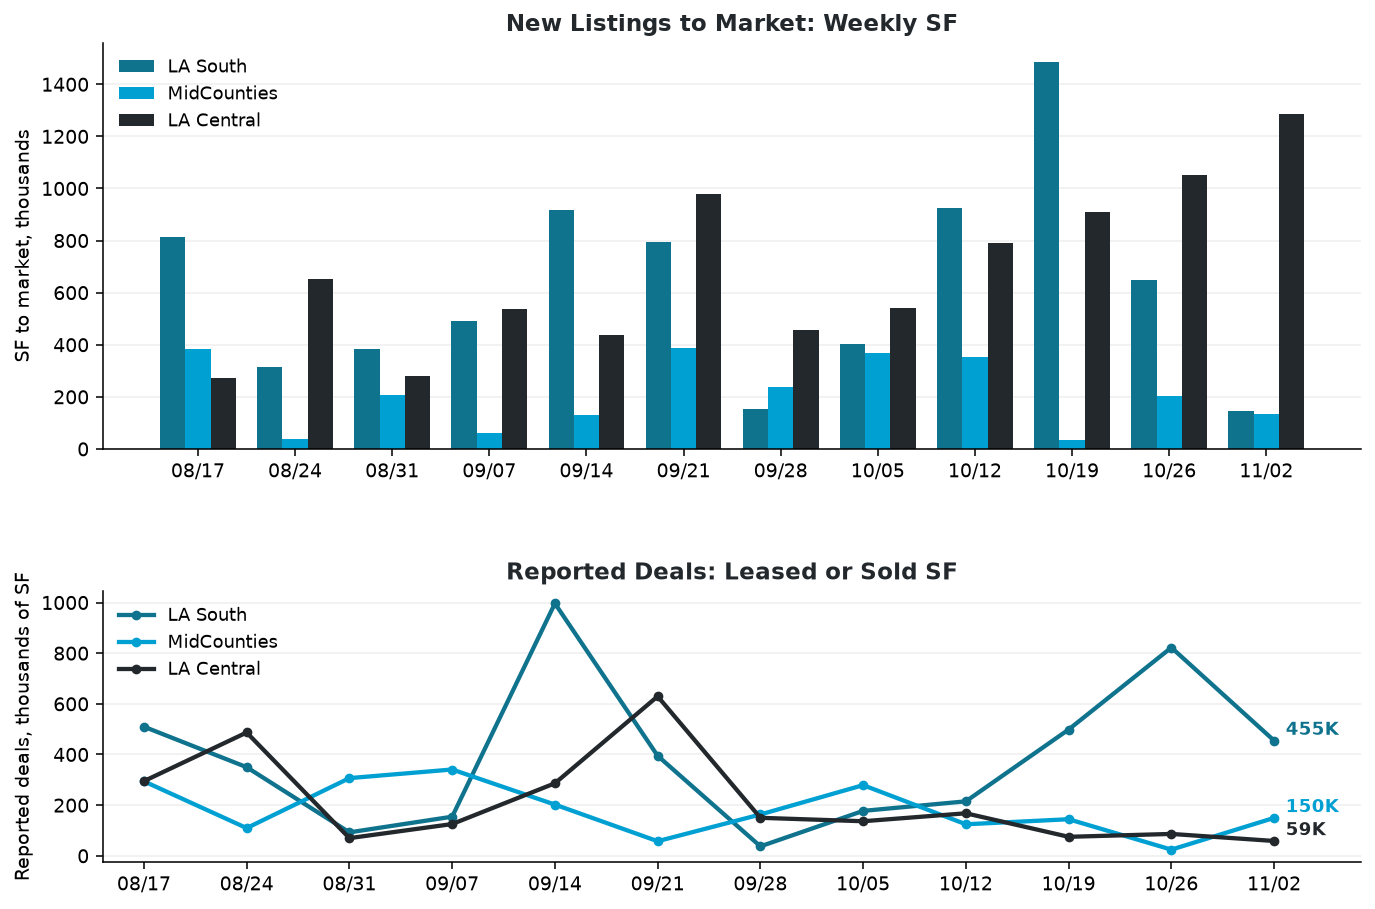
Top: new SF to market each week. Bottom: SF reported as Leased or Sold. Most listings exit the feed without a published deal, so reported deals understate true absorption.
What the Table Shows
LA Central brought the new supply this window. 227 arrivals floated 8.19 million SF of space, with the median new listing at about 15,268 SF: small bay inventory in the urban core. The marketplace reported 75 deals clearing 2.57 million SF. Arrivals outran reported deals in 11 of 12 weeks. Net change for the window: +152 listings and +5.62 million SF.
LA South shows steady offer-side flow. 160 arrivals brought 7.47 million SF to market, peaking at 22 arrivals in the week of 09/21/2026. The marketplace reported 90 deals clearing 4.70 million SF. Arrivals outran reported deals in 8 of 12 weeks. Net change: +70 listings and +2.77 million SF.
MidCounties runs the lightest flow of the three. 99 arrivals brought 2.54 million SF to market; the marketplace reported 47 deals clearing 2.20 million SF. Net change: +52 listings and +0.34 million SF.
What This Metric Measures
The AIR CRE broker marketplace is where LA industrial product gets floated. A listing counts as an arrival the week the marketplace first carries it: New Listing statuses for lease, for sale, for sublease, or for lease and sale. A listing counts as a reported deal the week the marketplace records it Leased or Sold. In Escrow is pending, not a deal, and is excluded. Square footage is the available SF being floated, not the total building size, and a property carrying multiple listings in one week is counted once. The window rolls forward each week: the oldest week drops off as the newest complete week lands.
How to read the Net column. The marketplace publishes a listing when it first appears and rarely reports its exit: most listings in this window never appear again as Leased or Sold, so reported deals understate true absorption. Net is arrivals minus reported deals for the week, properties and SF together, each figure colored by its own sign. It is an upper bound on accumulation: the most float the window could have added, with the exits the marketplace never reported left uncounted. True net change is smaller by however much of that gap actually leased.
Reading the Float
Float is a leading indicator. When new arrivals run persistently ahead of reported deals, space sits, asking rents face pressure, and tenant incentives get richer. When the two columns track together, existing product is clearing before new product competes with it, though some of any gap is deals the marketplace never reported. For tenants, heavy arrivals are leverage. For owners of well-located near-port product, reported deals holding up in their own submarket is the argument that their asset class is clearing. This page updates weekly. The arrivals column is the cleanest signal in this feed: read it first.
Methodology and Coverage
Source. AIR CRE broker marketplace listings, ingested daily by our research system. Weeks run Monday to Sunday.
Coverage note. LA Central marketplace coverage is daily. LA South and MidCounties coverage runs on the marketplace’s own publishing cadence, which is less frequent. A week with no recorded marketplace events reflects the marketplace’s publishing schedule, not market silence. This series is an open measurement: it will refine as coverage depth improves.
Vesperlight Real Estate Services tracks LA industrial conditions daily through AIR CRE data, port statistics, and direct broker relationships. Contact us for current market intelligence specific to your submarket.