
Monthly cargo throughput for the San Pedro Bay Port Complex, tracking POLA and POLB TEU data, tariff impacts on exports, empty container trends, and what it means for LA industrial real estate.
September 2026 Report
Port of Long Beach
▲ +25.0%
| Loaded Imports | 509,390 |
| Loaded Exports | 91,747 |
| Total Loaded | 601,137 |
| Total Empty | 396,040 |
| Total TEUs | 997,177 |
Port of Los Angeles
▲ +18.1%
| Loaded Imports | 545,696 |
| Loaded Exports | 125,751 |
| Total Loaded | 671,446 |
| Total Empty | 371,206 |
| Total TEUs | 1,042,652 |
▲ +21.4% Year-over-Year
What This Means for Industrial
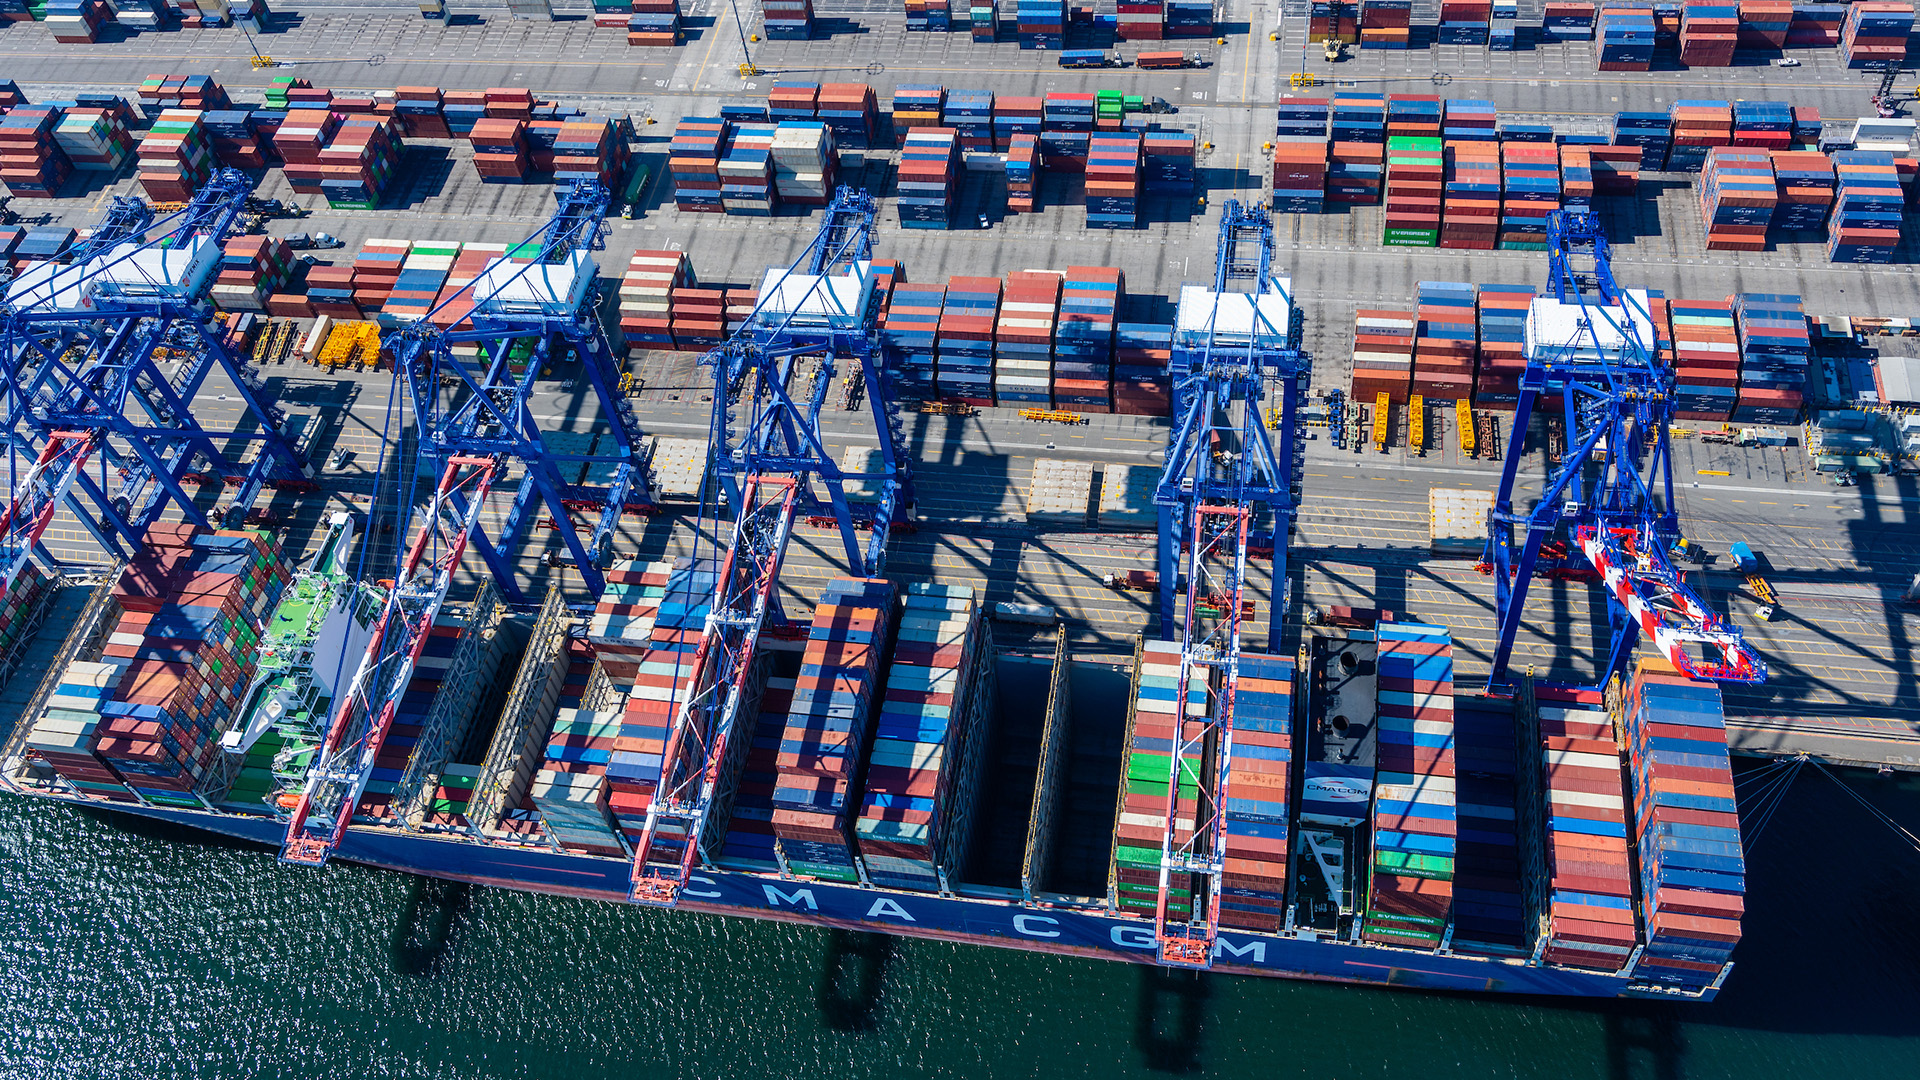
The San Pedro Bay port complex moved 2,039,829 TEUs in September, up 21.4% over the same month last year and the busiest month in the combined history of the two gateways. Both ports set all-time records in the same month: Los Angeles processed 1,042,652 TEUs, the busiest month in its 118-year history and more than 20,000 units above its previous record, while Long Beach moved 997,177 TEUs to break its own all-time mark. The quarter capped the strongest stretch on record at Los Angeles, with nearly 3 million TEUs crossing its docks from July through September. After a first half of tariff timing shifts and single-port divergence, the two ports are now surging together: combined year-to-date volume stands at 15.76 million TEUs, up 3.6%.
Import strength drove the record on both sides of the bay. Los Angeles loaded imports reached 545,696 TEUs, up 18.6% year over year and the tenth time the port has crossed the half-million mark in a single month. Long Beach loaded imports surged 31.3% to 509,390 TEUs. Port of Los Angeles Executive Director Gene Seroka attributed the run to three converging forces: tariffs running lower than earlier this year, resilient consumer demand, and cargo allocated to Los Angeles at origin as shippers route around continued challenges at the Panama and Suez Canals. Long Beach CEO Noel Hacegaba pointed to shippers moving goods ahead of a potential new trade deal between the US and China, rising fuel prices and Panama Canal access restrictions. For industrial landlords, the question is how much of this is genuine consumption versus pull-forward ahead of the next policy shift, a distinction that will shape first-quarter warehouse demand.
The export picture strengthened alongside the import surge. Long Beach loaded exports rose 7.8% to 91,747 TEUs, though outbound volume remains well below its import side. Los Angeles loaded exports climbed 9.6% to 125,751 TEUs, and its year-to-date outbound count now runs 20% ahead of last year, an export gain that stands out against a mostly flat national outbound trend. The US and China recently enacted a framework scaling back tariffs on $30 billion in bilateral imports, which may be restoring some confidence for exporters holding cargo back. For industrial tenants on the outbound side, especially food, agriculture and recyclables shippers in the Gateway Cities corridor, the September export pickup is the first encouraging signal after a soft first half.
Empty container movements set records of their own. Los Angeles empties hit 371,206 TEUs, the highest monthly total in that port’s history, up 20.4% year over year, as carriers rushed boxes back to Asia to reposition for the next import wave. Long Beach empties climbed 22.1% to 396,040 TEUs. Roughly 38% of September’s combined moves were empty repositioning, a structural signature of the import-heavy trade imbalance. The year-to-date empty ratio at Long Beach sits at 38.9% versus 40.3% at the same point last year, while Los Angeles holds at 34.6% versus 34.2%. For warehouse and distribution operators in the South Bay, Gateway Cities and Harbor Gateway, the empty flow is the visible evidence that inbound demand still dominates the cargo mix, keeping import-facing logistics space in the strongest position.
The bottom line: September was a record month at both ports simultaneously, and the complex enters the fourth quarter with genuine momentum rather than a pull-forward hangover. Los Angeles expects roughly 900,000 TEUs in October, which would still be a 6.1% increase over last October, and most holiday merchandise should be in the country by early November. Watch the October print for whether the extended peak season holds into the holiday build, and whether the US-China framework turns into a durable agreement that lets shippers plan past a single quarter. Port-adjacent industrial demand has stayed firmer than forecast all year, and record throughput with record empty repositioning keeps pressure on South Bay, Gateway Cities and Harbor Gateway vacancy into the fourth quarter.
2025 vs 2026 Monthly Total TEUs (San Pedro Bay Combined)
12-Month Trailing TEU Data
| Month | POLB | POLA | Combined | YoY |
|---|---|---|---|---|
| Oct 2025 | 839,673 | 848,424 | 1,688,097 | -10.8% |
| Nov 2025 | 817,561 | 782,249 | 1,599,810 | -9.5% |
| Dec 2025 | 834,118 | 791,588 | 1,625,706 | -8.8% |
| Jan 2026 | 847,766 | 812,000 | 1,659,766 | -11.6% |
| Feb 2026 | 767,526 | 824,323 | 1,591,849 | +1.6% |
| Mar 2026 | 774,936 | 752,520 | 1,527,456 | -4.3% |
| Apr 2026 | 817,993 | 890,861 | 1,708,854 | -0.1% |
| May 2026 | 842,031 | 840,164 | 1,682,196 | +24.1% |
| Jun 2026 | 779,331 | 1,002,734 | 1,782,065 | +11.6% |
| Jul 2026 | 928,509 | 960,464 | 1,888,973 | -3.8% |
| Aug 2026 | 919,992 | 955,907 | 1,875,899 | +0.8% |
| Sep 2026 | 997,177 | 1,042,652 | 2,039,829 | +21.4% |