
The Quarter at a Glance
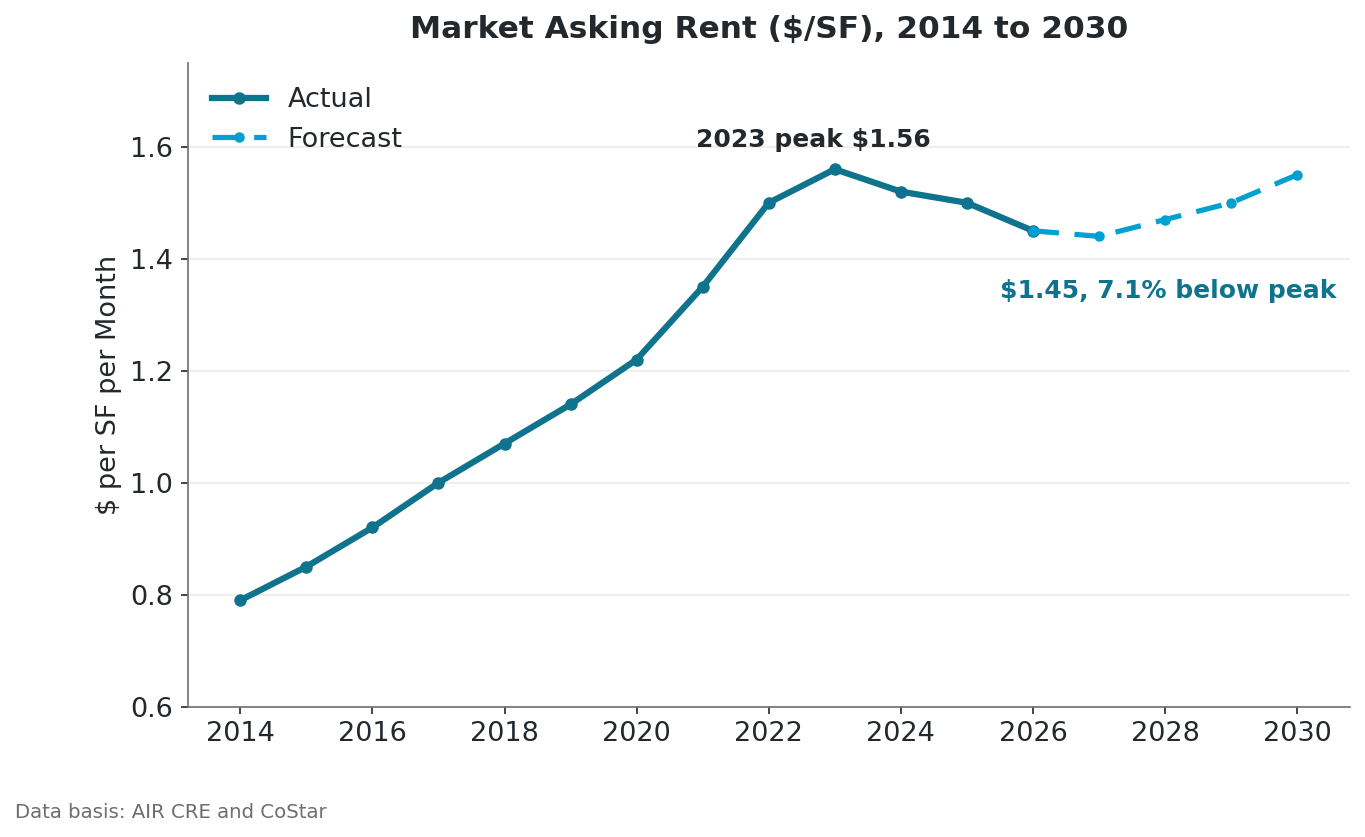
| 6.1%VacancyHistorical average 4.0%. Peaked mid year at 6.8% and is holding flat. | $1.45Asking Rent ($/SF)Down 3.7% year over year. 7.1% below the 2023 peak of $1.56. | +2.2MNet Absorption (SF, 12 mo)Four straight quarters of improvement. |
| 4.4MUnder Construction (SF)About 40% preleased. Deliveries run at half the historical average. | $5.2BSales Volume (YTD)765 transactions. Median cap rate 5.9%. | 5.9%Median Cap RateUp roughly 150 basis points from the 4.2% of early 2022. |
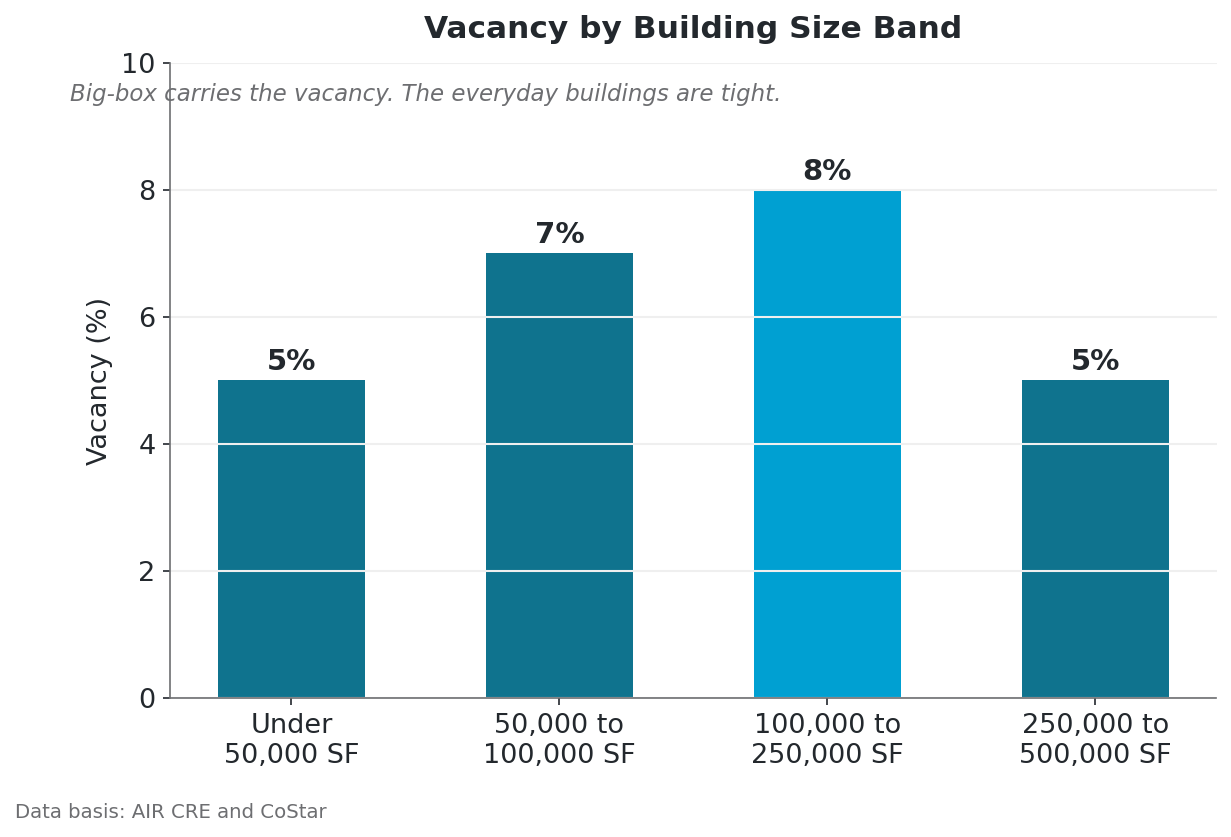
One index, two markets. Buildings under 50,000 square feet run near 5% vacancy while the 100,000 to 250,000 square foot band holds a record above 8%. The statistics below the headline are the story, and this report walks through them.
Data basis: AIR CRE and CoStar.
A Tale of Two Markets
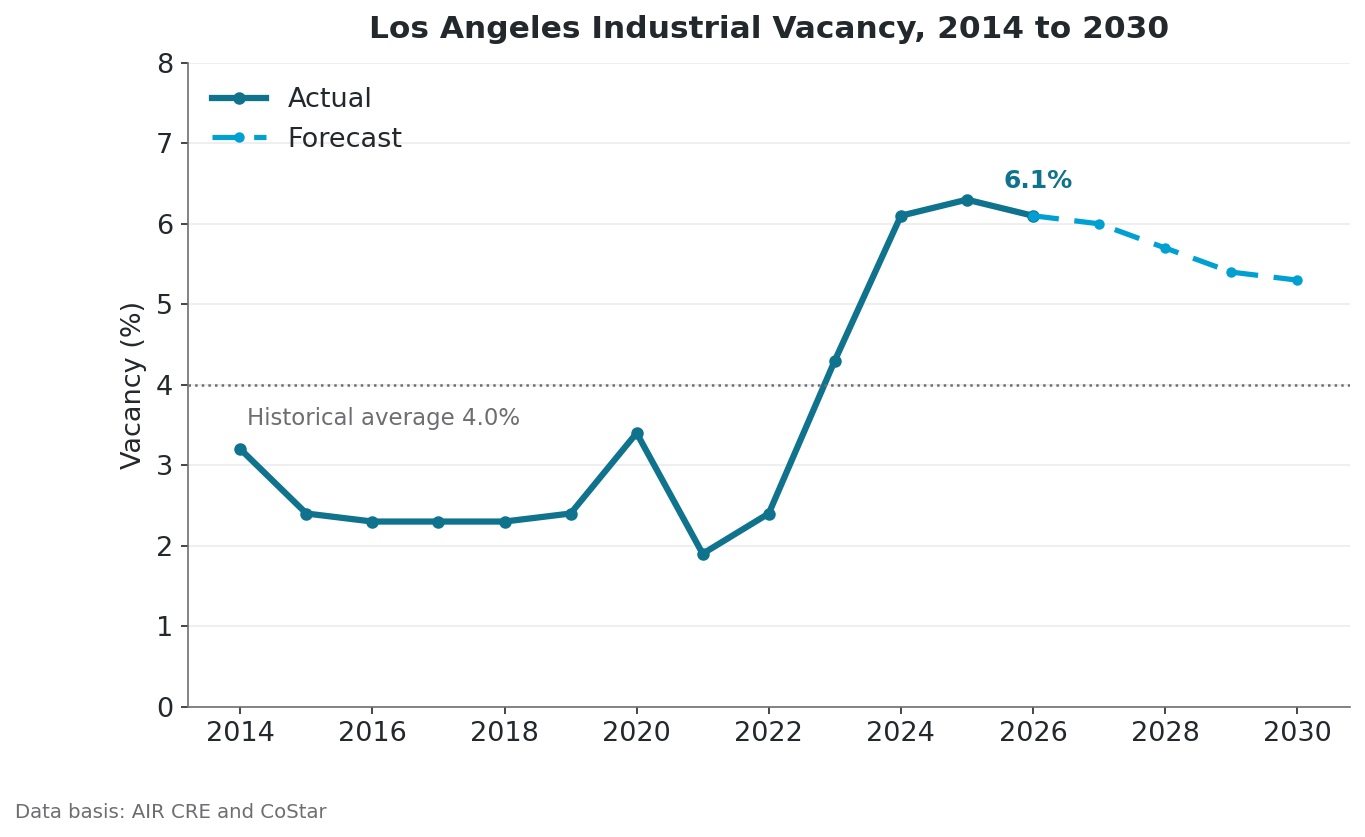
The national houses publish good data. CBRE, Newmark, and Cushman & Wakefield report a Los Angeles industrial market with vacancy at 6.1%, asking rents down 3.7% year over year, and a record quarter of new leasing. All accurate at the level they report it. What none of them do is follow their own numbers to where they clearly point: this market no longer behaves as one market.
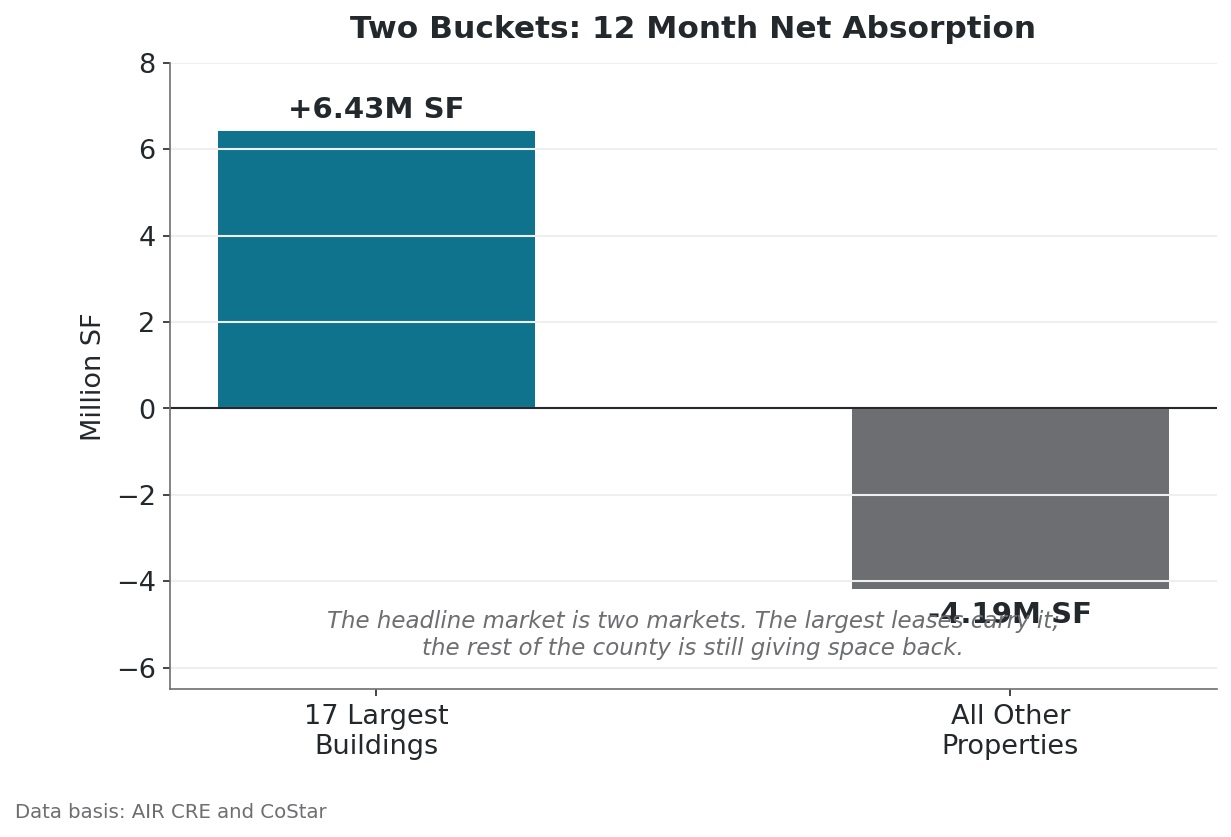
Over the trailing twelve months, the seventeen largest lease moves in the county added 6.43 million square feet of net absorption. Every other property in Los Angeles gave back 4.19 million square feet over the same period. Two buckets, one index. Read the index and you see stabilization. Read the buckets and you see a market splitting in two.
The first bucket is big box and advanced manufacturing. Valar Atomics preleased 512,000 square feet in the South Bay. Amazon signed 505,000 square feet. Sares-Regis leased its 215,000 square foot campus before delivery. Those three moves alone carried the year. They also concentrate the risk: the 100,000 to 250,000 square foot band now holds record vacancy above 8%.
The second bucket is the everyday market, the 10,000 to 100,000 square foot buildings where local business actually operates. There the picture is entirely different. Buildings under 50,000 square feet run near 5% vacancy. Our own ledger tells the same story from the tenant side: signed leases between 10,000 and 100,000 square feet this year, not one of them an advanced manufacturing deal, at a median achieved rent of $1.30 per square foot and an interquartile range of $1.04 to $1.51.
The advanced manufacturing premium is real. In our own book, the startup manufacturers building rockets, satellites, and reactors inside the same size band paid an average of $1.83 per square foot, forty one percent above the everyday median. The same buildings command two different markets depending on who walks in the door.
Concessions are a big box story too. Four months of free rent on a 116,000 square foot H Mart deal. Effective rents down as much as 30% on some large format renewals. The everyday market has no such reckoning. It never had the peak.
Two buckets, one index. The houses report the index. The reader owns one building, and which bucket that building sits in decides what the market is doing to it this quarter. We keep those answers. For the numbers behind any claim in this report, or the read on a specific property, reach out.
Prologis Is Full. Its Newest Revenue Hasn’t Shown Up Yet.
| PLD (NYSE) | $127.98 |
| Q3 2026 | -4.2% ($135.47 on 06/30/2026 to $129.84 on 09/30/2026) |
| From late July high | -12.5% |
| 52 week range | $121.40 to $153.35 (16.5% below the high) |
Share data through 10/30/2026. A logistics REIT’s quarter, and the market’s answer to it.
Prologis earned its quarter. The largest logistics landlord in the world signed 60 million square feet of leases, lifted period end occupancy to 95.6%, and raised its same store cash NOI growth guidance to as much as 7.5%. Shareholders approved the SEGRO combination, extending the platform across Europe. These are the numbers of the best operator in the institutional lane, and they deserve the credit they get.
It is not the whole story, and the share price says so. The newest leases, including the advanced manufacturing deals Prologis has taken advantage of, just commenced. The quarter’s own numbers carry the signature: average occupancy ran 95.1% while period end finished at 95.6%. On a platform of 1.3 billion square feet, that half point is roughly 6.5 million square feet of space, occupied at quarter close, barely present in the quarter’s average. It is more space than every industrial project under construction in Los Angeles County combined. Those leases are live. Their contribution to the revenue stream has not been represented yet, and investors are pricing the book that existed before them. Q4 reports a different picture.
There is also the matter of attention. Capital chases the story of the moment, and the story of the moment is artificial intelligence: a GPU shortage makes headlines and pulls money. A logistics REIT, however well it executes, does not. That is not a complaint. It is simply how attention works. The quiet irony sits in Prologis’ own letter: the demand it cites, advanced manufacturing and the build out of the data center supply chain, is the physical economy of the AI boom landing in warehouses. The company holds a 5.8 gigawatt data center power pipeline in secured or advanced stages. The attention goes to the chip. The work goes to the building.
Prologis is bucket one telemetry. The buildings most readers of this report own do not appear in its statistics at all. Whether the sentiment gap lands on your building as a valuation question or a buying window depends on which bucket you are in. That is the conversation.
Capital Markets: The Repricing Is the Window
Los Angeles industrial trades at a 5.9% median cap rate, up roughly 150 basis points from the 4.2% of early 2022. $5.2 billion has traded year to date across 765 transactions, an average of $10.2 million per deal at $277 per square foot. Institutional buyers and REITs have accounted for about 30% of acquisition volume over the past three years.
The quarter’s signature trades say more than the averages. A $17.5 million sale on Triumph Street in Los Angeles closed at $435 per square foot and a 5.5% cap rate. Rexford took a $1.2 billion portfolio to EQT, 44% of it Los Angeles County, at a weighted average lease term of 2.7 years and in place rents roughly 28% below market at close, underwritten to a 5.5% yield in 2027. On Manhattan Place, a $14.7 million sale at $417 per square foot closed the same day as its 35,250 square foot lease at a $2.35 starting rent. A building leased at a market clearing rate and priced the same afternoon. It happens when the lease is real.
The repricing is not a distress story. It is a normalization, and the everyday market is where it pays. A 5.9% median cap rate against an everyday lease market holding a $1.30 median rent and near 5% small building vacancy is the best arithmetic this asset class has offered since 2022. The houses have the data right. The window is ours to point out. Which side of that arithmetic your building sits on is a twenty minute conversation.
Freight and the Flow: The Port Lane Reorders Itself
Los Angeles is a port market, and the vacancy story of the last three years has been a freight story. Vacancy rose sharpest in the port-proximate submarkets, Vernon and Long Beach, as logistics tenants vacated older and less efficient buildings for modern space, or left the market entirely.
The last four quarters have turned that picture halfway around. The three strongest absorption submarkets in the county are all port lane: Vernon at +1.13 million square feet, Commerce at +998,000, Long Beach at +944,000. Meanwhile the inland valleys keep bleeding: City of Industry gave back 446,000 square feet and Santa Clarita 939,000. Freight demand is not leaving the region. It is consolidating closer to the water and into buildings that can carry modern throughput: higher clearance, more doors, truck court depth. The older stock a mile inland competes for the everyday user, at everyday rents.
The macro current underneath is mixed. Import activity through Southern California has been volatile, business inventories sit elevated, and the county population resumed its decline in 2025, all of which cap the demand upside for population serving distribution. What has not changed is the geography: the San Pedro Bay port complex is the largest container gateway in the country, and every container moving through it gets touched, stored, cross docked, and repaired in a building. The question for an owner is which building. The index does not answer it. The port lane does.
Freight moves to cost. Buildings move to freight. The everyday owner near the ports holds the last mile of the largest import economy in the country, and at a $1.30 median rent the market has not yet paid for that position.
Outlook: The Forecast and Your Building
The base case has vacancy declining from 2027, from 6.1% today to 5.3% by 2030. Market asking rents turn next year and recover 3.3% by 2030 to $1.55, still just below the 2023 peak of $1.56. Sublease availability has already tightened from 1.4% to 1.1%. Deliveries run at 2.7 million square feet trailing twelve months against a 5.5 million historical average, and about 40% of what is under construction is preleased. Los Angeles is not overbuilding. Its inventory actually shrank 482,000 square feet this year. Demolitions are outpacing deliveries.
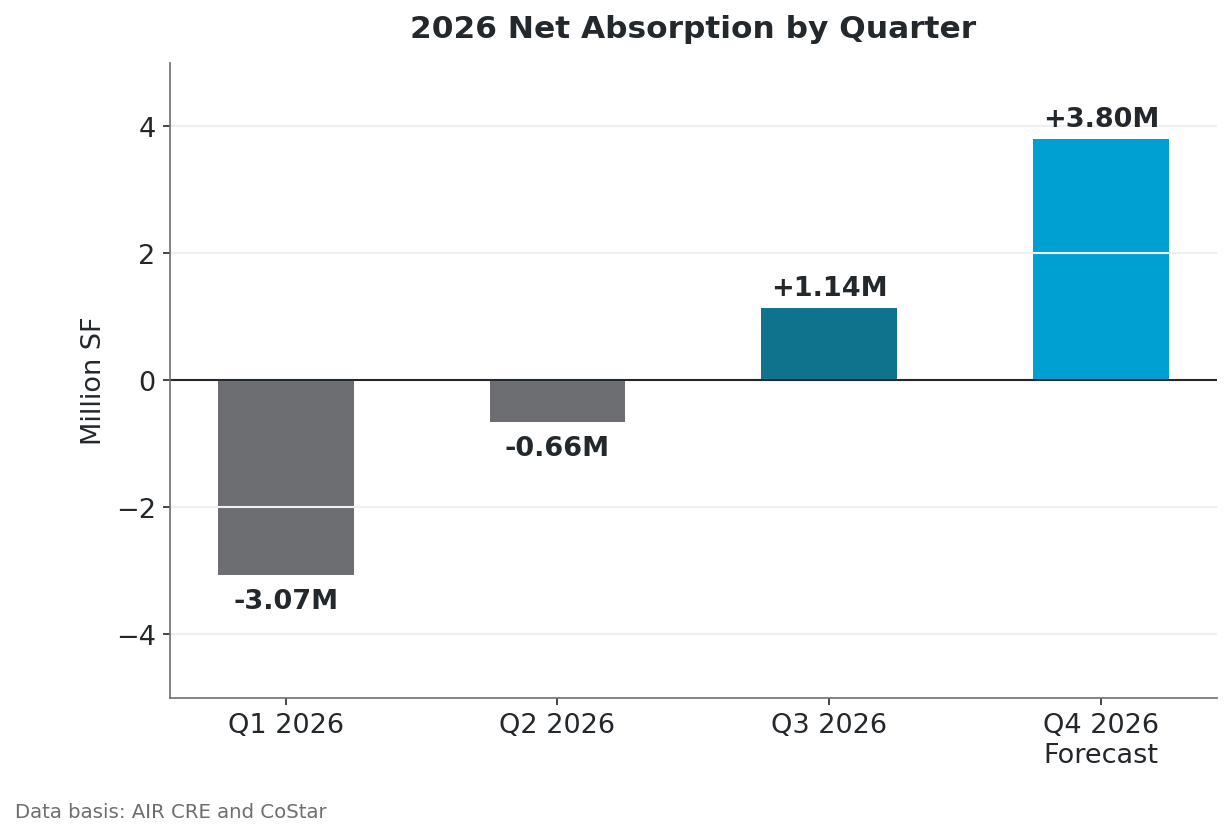
A forecast is a population average. Your building is not a population. The index says vacancy declines in 2027. The bucket your building sits in says whether that decline means a bidding war or another quiet year. Reading that difference is what we do. For the numbers behind any claim in this report, or the read on a specific property, reach out.
Appendix: The Numbers Behind Every Claim
Every statistic in this report is checkable here. Data basis: AIR CRE and CoStar. Our comp tables include achieved rents only. An asking rent is a wish, not a comp.
Market Series, 2014 to 2030
| Year | Asking ($/SF) | Vacancy | Net Abs. (M SF) |
|---|---|---|---|
| 2014 | $0.79 | 3.2% | +11.59 |
| 2015 | $0.85 | 2.4% | +7.55 |
| 2016 | $0.92 | 2.3% | +0.78 |
| 2017 | $1.00 | 2.3% | +3.70 |
| 2018 | $1.07 | 2.3% | +1.30 |
| 2019 | $1.14 | 2.4% | -1.64 |
| 2020 | $1.22 | 3.4% | -7.48 |
| 2021 | $1.35 | 1.9% | +14.35 |
| Year | Asking ($/SF) | Vacancy | Net Abs. (M SF) |
|---|---|---|---|
| 2022 | $1.50 | 2.4% | -4.08 |
| 2023 | $1.56 | 4.3% | -17.49 |
| 2024 | $1.52 | 6.1% | -14.88 |
| 2025 | $1.50 | 6.3% | +1.06 |
| 2026 YTD | $1.45 | 6.1% | +1.21 |
| 2027 F | $1.44 | 6.0% | +0.54 |
| 2028 F | $1.47 | 5.7% | +0.27 |
| 2029 F | $1.50 | 5.4% | -0.21 |
| 2030 F | $1.55 | 5.3% | -1.30 |
Everyday Signed Leases, Aggregate View
Our everyday ledger, summarized. The individual transactions behind these numbers are client confidential. We share deal level terms in person, in reciprocity.
| Metric | Value |
|---|---|
| Median achieved base rent | $1.30/SF |
| Interquartile range | $1.04 to $1.51/SF |
| Full range | $0.56 to $2.35/SF |
| Median building size | 27,468 SF |
| Median lease term | 60 months |
| Median rent, 10,000 to 25,000 SF | $1.25/SF |
| Median rent, 25,000 to 50,000 SF | $1.40/SF |
| Median rent, 50,000 to 100,000 SF | $1.40/SF |
Comp criteria: signed leases, 10,000 to 100,000 square feet, achieved base rent, closed 2026 year to date, Los Angeles South and MidCounties submarkets. Advanced manufacturing tenants are excluded from the everyday set and reported separately; in our book they paid an average of $1.83 per square foot inside the same size band. Data basis: AIR CRE and CoStar. Market series from the same basis, forecast years noted.
The deal level detail behind every number in this report sits in our ledger. Signed leases with terms, concessions, and commencing dates stand behind every aggregate shown above. If you want a formative discussion about what this market is doing to a specific building, that conversation starts with the data, and the data starts here.
info@vesperlightre.com | (310) 758-4245 | vesperlightre.com
Data basis: AIR CRE and CoStar. Data and commentary by Vesperlight Real Estate Services.