

Consumer Price Index (CPI-U) data with a calculator for determining indexed rent increases. Many commercial leases tie annual escalations to CPI changes. Use the calculator below to compute the percentage increase between any two periods, then reference the historical tables for detailed index values.
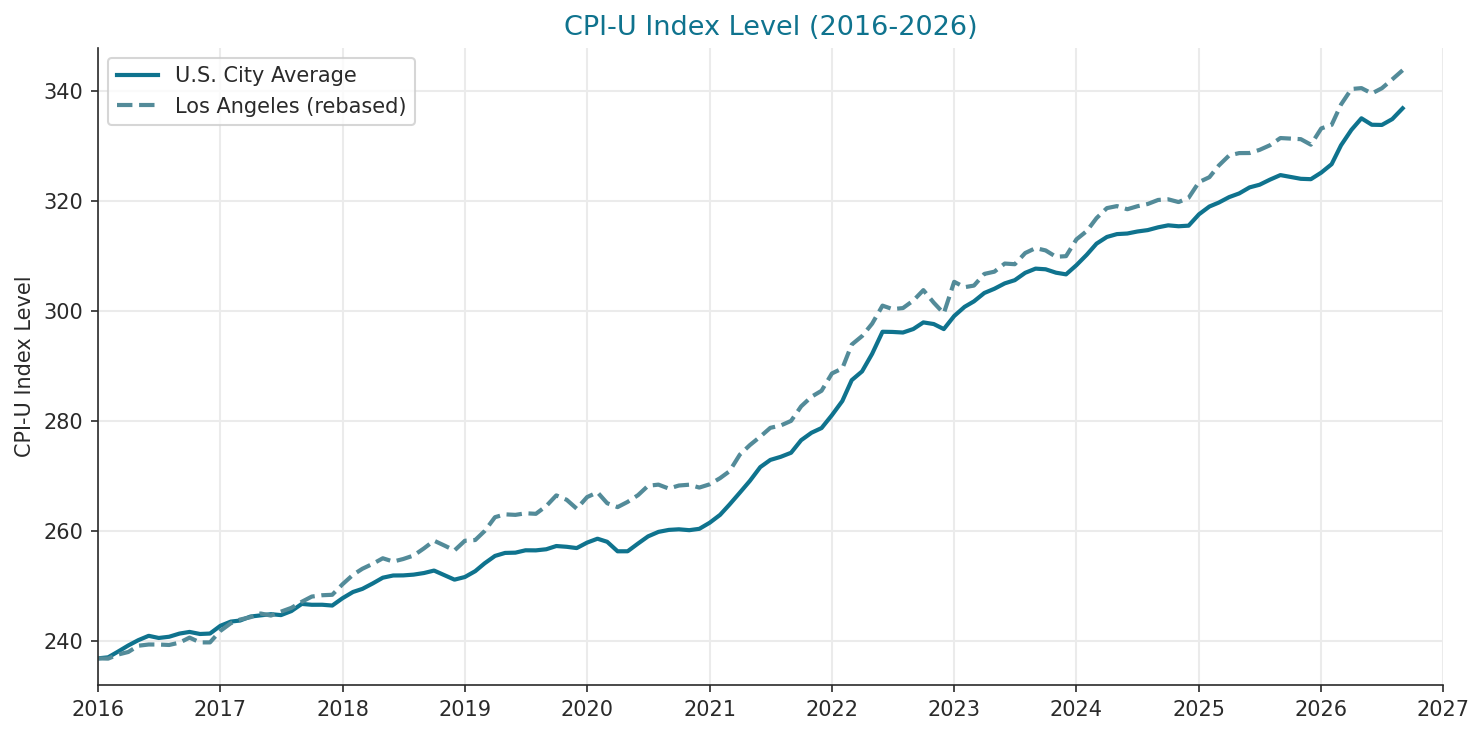
U.S. CPI-U Index Level
Consumer Price Index for All Urban Consumers, All Items. Source: U.S. Bureau of Labor Statistics.
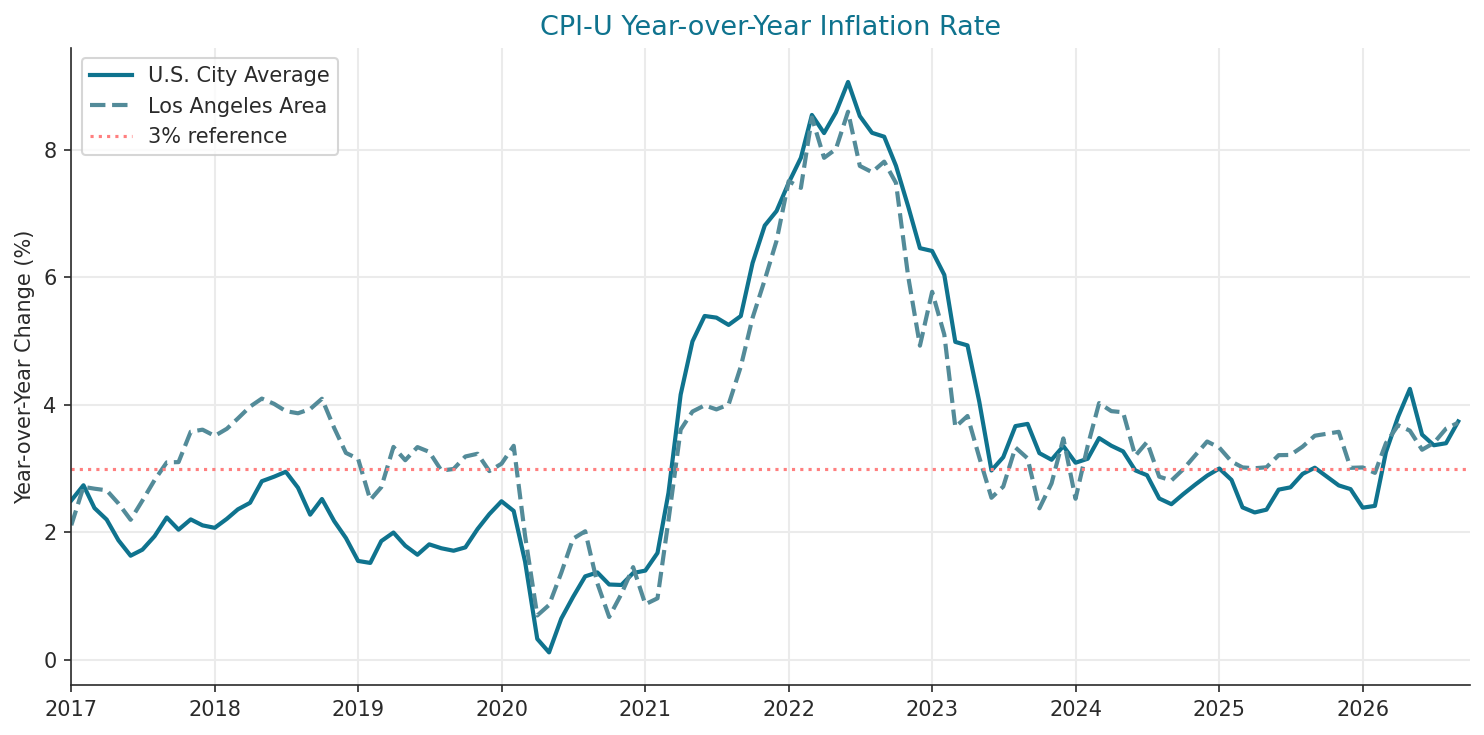
Year-over-Year Inflation Rate
Monthly year-over-year percent change in CPI-U. The 3% reference line reflects a common commercial lease escalation rate.
Federal CPI-U: U.S. City Average
| Yr | Jan | Feb | Mar | Apr | May | Jun | Jul | Aug | Sep | Oct | Nov | Dec | H1 | H2 | Ann |
|---|---|---|---|---|---|---|---|---|---|---|---|---|---|---|---|
| 2026 | 325.252 | 326.785 | 330.213 | 333.020 | 335.123 | 333.952 | 333.918 | 334.980 | 336.940 | – | – | – | 330.724 | – | – |
| 2025 | 317.671 | 319.082 | 319.799 | 320.795 | 321.465 | 322.561 | 323.048 | 323.976 | 324.800 | – | 324.122 | 324.054 | 320.229 | 324 | 321.943 |
| 2024 | 308.417 | 310.326 | 312.332 | 313.548 | 314.069 | 314.175 | 314.540 | 314.796 | 315.301 | 315.664 | 315.493 | 315.605 | 312.145 | 315.233 | 313.689 |
| 2023 | 299.170 | 300.840 | 301.836 | 303.363 | 304.127 | 305.109 | 305.691 | 307.026 | 307.789 | 307.671 | 307.051 | 306.746 | 302.408 | 306.996 | 304.702 |
| 2022 | 281.148 | 283.716 | 287.504 | 289.109 | 292.296 | 296.311 | 296.276 | 296.171 | 296.808 | 298.012 | 297.711 | 296.797 | 288.347 | 296.963 | 292.655 |
| 2021 | 261.582 | 263.014 | 264.877 | 267.054 | 269.195 | 271.696 | 273.003 | 273.567 | 274.310 | 276.589 | 277.948 | 278.802 | 266.236 | 275.703 | 270.970 |
| 2020 | 257.971 | 258.678 | 258.115 | 256.389 | 256.394 | 257.797 | 259.101 | 259.918 | 260.280 | 260.388 | 260.229 | 260.474 | 257.557 | 260.065 | 258.811 |
| 2019 | 251.712 | 252.776 | 254.202 | 255.548 | 256.092 | 256.143 | 256.571 | 256.558 | 256.759 | 257.346 | 257.208 | 256.974 | 254.412 | 256.903 | 255.657 |
| 2018 | 247.867 | 248.991 | 249.554 | 250.546 | 251.588 | 251.989 | 252.006 | 252.146 | 252.439 | 252.885 | 252.038 | 251.233 | 250.089 | 252.125 | 251.107 |
| 2017 | 242.839 | 243.603 | 243.801 | 244.524 | 244.733 | 244.955 | 244.786 | 245.519 | 246.819 | 246.663 | 246.669 | 246.524 | 244.076 | 246.163 | 245.120 |
| 2016 | 236.916 | 237.111 | 238.132 | 239.261 | 240.229 | 241.018 | 240.628 | 240.849 | 241.428 | 241.729 | 241.353 | 241.432 | 238.778 | 241.237 | 240.007 |
X : Data unavailable due to the 2025 lapse in appropriations
Los Angeles Area CPI-U
| Yr | Jan | Feb | Mar | Apr | May | Jun | Jul | Aug | Sep | Oct | Nov | Dec | H1 | H2 | Ann |
|---|---|---|---|---|---|---|---|---|---|---|---|---|---|---|---|
| 2026 | 1027.230 | 1029.213 | 1040.617 | 1049.319 | 1049.821 | 1046.833 | 1049.745 | 1054.715 | 1059.834 | – | – | – | 1040.506 | – | – |
| 2025 | 997.148 | 999.896 | 1006.426 | 1012.090 | 1013.404 | 1013.445 | 1015.217 | 1017.816 | 1021.839 | – | 1021.205 | 1018.108 | 1007.068 | 1018.837 | 1012.418 |
| 2024 | 965.040 | 969.743 | 976.949 | 982.566 | 983.700 | 981.930 | 983.616 | 984.889 | 987.147 | 987.499 | 985.952 | 988.352 | 976.655 | 986.243 | 981.449 |
| 2023 | 941.261 | 938.247 | 939.139 | 945.686 | 946.941 | 951.494 | 951.126 | 957.388 | 960.148 | 958.851 | 955.292 | 955.632 | 943.795 | 956.406 | 950.100 |
| 2022 | 889.906 | 892.725 | 906.065 | 910.861 | 917.795 | 927.908 | 925.967 | 926.537 | 930.748 | 936.600 | 929.565 | 923.563 | 907.543 | 928.830 | 918.187 |
| 2021 | 827.771 | 831.223 | 835.067 | 844.403 | 849.756 | 854.479 | 859.418 | 860.727 | 863.315 | 871.446 | 876.850 | 880.203 | 840.450 | 868.660 | 854.555 |
| 2020 | 820.612 | 823.275 | 817.166 | 814.991 | 817.913 | 821.692 | 826.946 | 827.588 | 825.370 | 827.088 | 827.545 | 825.943 | 819.275 | 826.747 | 823.011 |
| 2019 | 796.129 | 796.542 | 801.573 | 809.356 | 810.932 | 810.640 | 811.534 | 811.228 | 815.585 | 821.558 | 819.088 | 814.106 | 804.195 | 815.517 | 809.856 |
| 2018 | 771.805 | 777.054 | 780.441 | 783.207 | 786.319 | 784.470 | 785.904 | 787.846 | 791.885 | 796.171 | 793.446 | 790.700 | 780.549 | 790.992 | 785.771 |
| 2017 | 745.623 | 749.881 | 751.980 | 753.297 | 755.374 | 754.196 | 756.405 | 758.521 | 761.921 | 764.857 | 765.598 | 765.850 | 751.725 | 762.192 | 756.959 |
| 2016 | 730.207 | 730.081 | 732.326 | 733.789 | 737.292 | 737.989 | 737.973 | 737.723 | 739.038 | 741.855 | 739.156 | 739.171 | 733.614 | 739.153 | 736.383 |
X : Data unavailable due to the 2025 lapse in appropriations
CPI-U data sourced from the U.S. Bureau of Labor Statistics. The calculator uses monthly index values to compute the percentage change between two periods. For leases specifying semi-annual or annual average CPI, use the appropriate averaging method per your lease terms. The Federal index uses base 1982-84=100; the Los Angeles index uses base 1967=100. Calculator supports both the Federal and Los Angeles area indices.