
Monthly cargo throughput for the San Pedro Bay Port Complex, tracking POLA and POLB TEU data, tariff impacts on exports, empty container trends, and what it means for LA industrial real estate.
October 2026 Report
Port of Long Beach
▲ +11.7%
| Loaded Imports | 461,909 |
| Loaded Exports | 93,874 |
| Total Loaded | 555,783 |
| Total Empty | 381,932 |
| Total TEUs | 937,715 |
Port of Los Angeles
▲ +21.0%
| Loaded Imports | 538,620 |
| Loaded Exports | 114,981 |
| Total Loaded | 653,600 |
| Total Empty | 373,271 |
| Total TEUs | 1,026,872 |
▲ +16.4% Year-over-Year
What This Means for Industrial
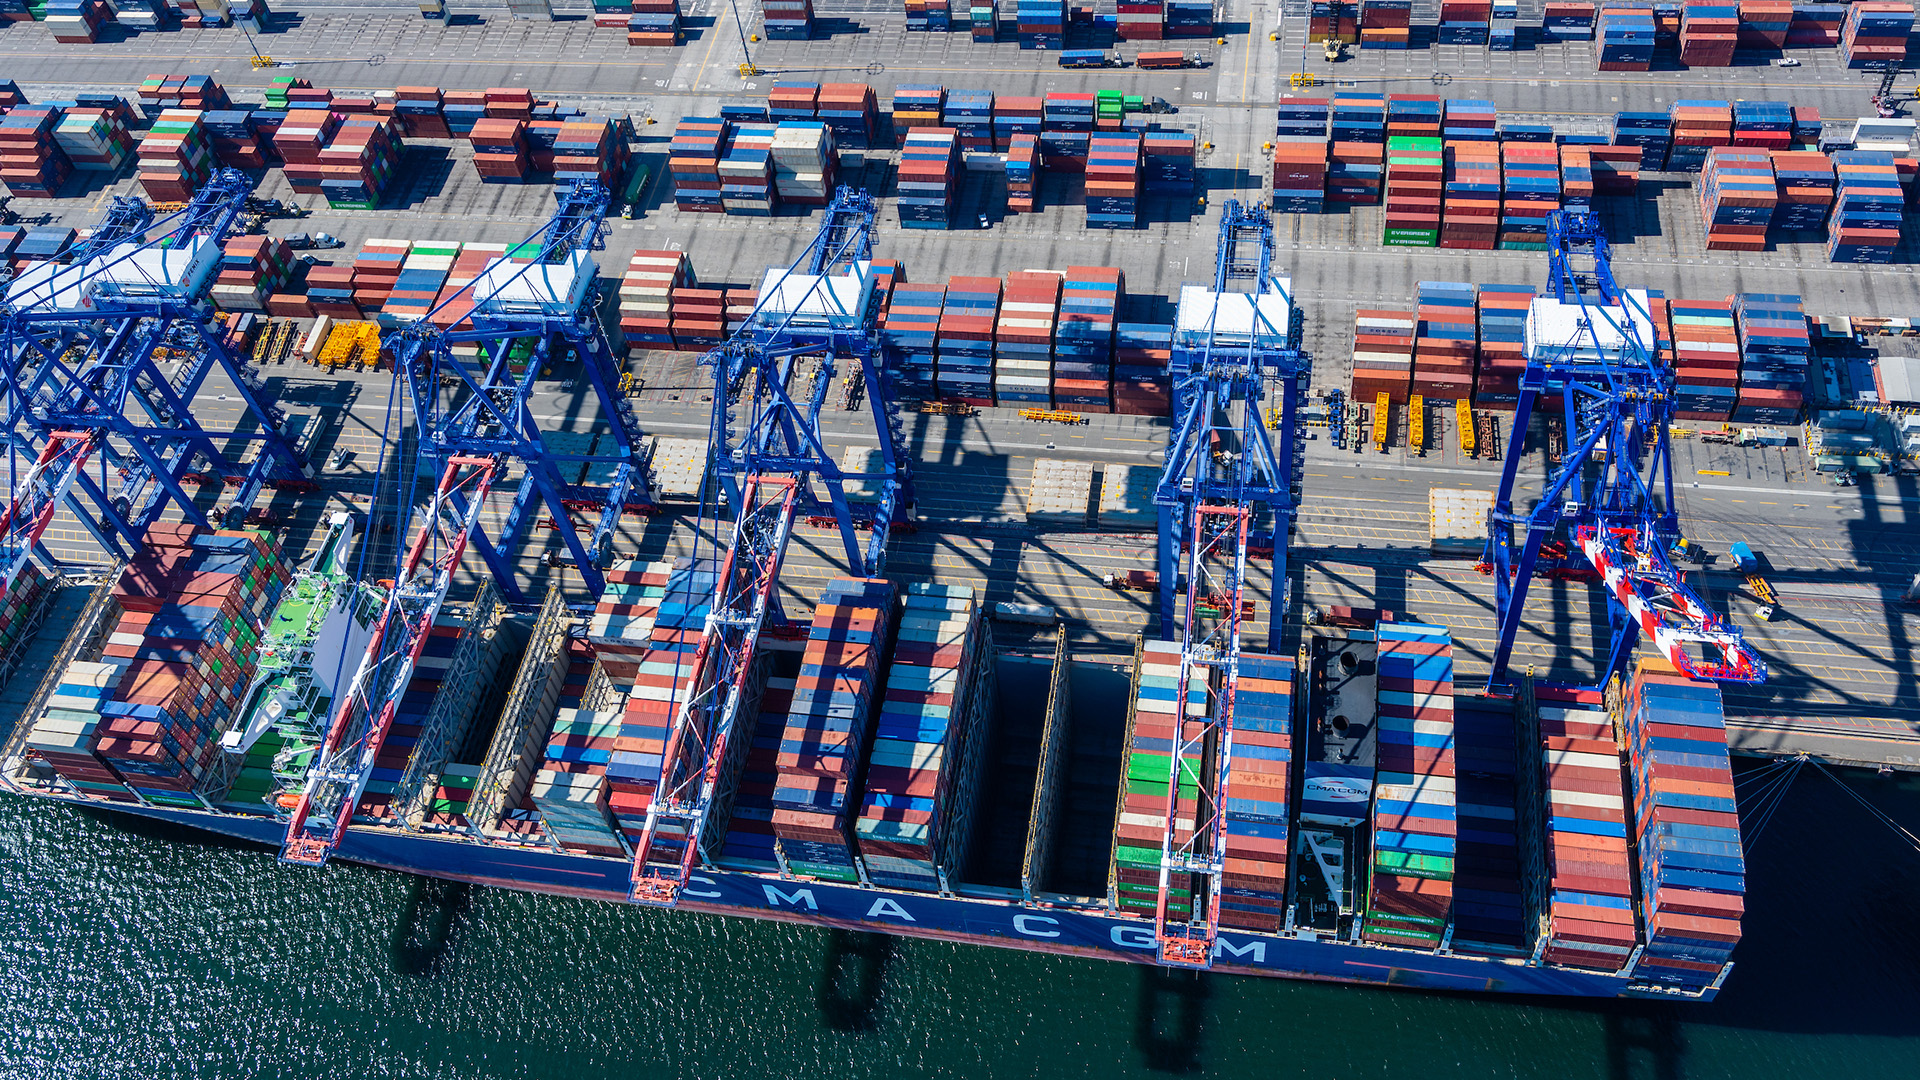
The San Pedro Bay port complex moved 1,964,587 TEUs in October, up 16.4% over the same month last year, the second-strongest month in the combined history of the two gateways behind only September’s record. Los Angeles processed 1,026,872 TEUs, up 21.0% and its third month above the million-unit mark this year, while Long Beach handled 937,715 TEUs, up 11.7% and its second-busiest October on record. Combined loaded imports at the two ports crossed one million TEUs for the second consecutive month. After a first half of tariff timing shifts and single-port divergence, both gateways are now surging together: combined year-to-date volume stands at 17.72 million TEUs, up 4.9%.
Import strength kept the extended peak season running well past its usual close. Los Angeles loaded imports reached 538,620 TEUs, up 25.5% year over year, and Long Beach loaded imports rose 14.9% to 461,909 TEUs, with cargo tied to the AI buildout among the growth drivers at both ports. Port of Los Angeles Executive Director Gene Seroka attributed the October surge to changing trade policy, uncertainty along other global shipping routes, continued consumer spending and retailers restocking inventory. Long Beach CEO Noel Hacegaba expects elevated volumes through at least the start of the new year, and possibly through the first quarter, as shippers frontload goods ahead of the US-China trade truce that now runs through January 10. For industrial landlords, the open question is how much of this is genuine consumption versus pull-forward ahead of that deadline, a distinction that will shape first-quarter warehouse demand.
The export picture weakened across the bay, with October marking the first month this year that outbound volume fell at both ports simultaneously. Long Beach loaded exports dropped 6.0% to 93,874 TEUs, and Los Angeles loaded exports fell 7.1% to 114,981 TEUs, leaving its year-to-date outbound count down 2% against last year while Long Beach still holds an 8% year-to-date export gain. The truce extension buys planning visibility on the import side, but outbound US cargo has yet to see equivalent relief, and exporters remain cautious against the risk of the tariff schedule snapping back after January 10. For industrial tenants on the outbound side, especially food, agriculture and recyclables shippers in the Gateway Cities corridor, October is a step back after September’s pickup.
Empty container movements set the pace underneath the headline numbers. Los Angeles empties reached 373,271 TEUs, up 26.4% year over year, and Long Beach empties climbed 13.0% to 381,932 as carriers rushed boxes back to Asia to reposition for the next import wave. Just over 38% of October’s combined moves were empty repositioning, the structural signature of an import-heavy trade balance. The year-to-date empty ratio at Long Beach sits at 39.1% versus 40.3% at the same point last year, while Los Angeles holds at 34.8% versus 34.3%. For warehouse and distribution operators in the South Bay, Gateway Cities and Harbor Gateway, the empty flow remains the visible evidence that inbound demand still dominates the cargo mix, keeping import-facing logistics space in the strongest position.
The bottom line: the extended peak season is carrying deeper into the fourth quarter than forecast, and October’s print beat the 900,000 TEUs Los Angeles had projected for itself by more than 120,000 units. Watch the November data for whether frontloading ahead of the January 10 truce deadline keeps volumes elevated into what is normally the slow season, and for the office watchmen negotiations at the complex, where a November 20 strike deadline at six terminals could slow both ports at once. Port-adjacent industrial demand has stayed firmer than forecast all year, and near-record throughput with heavy empty repositioning keeps pressure on South Bay, Gateway Cities and Harbor Gateway vacancy into year end.
2025 vs 2026 Monthly Total TEUs (San Pedro Bay Combined)
12-Month Trailing TEU Data
| Month | POLB | POLA | Combined | YoY |
|---|---|---|---|---|
| Nov 2025 | 817,561 | 782,249 | 1,599,810 | -9.5% |
| Dec 2025 | 834,118 | 791,588 | 1,625,706 | -8.8% |
| Jan 2026 | 847,766 | 812,000 | 1,659,766 | -11.6% |
| Feb 2026 | 767,526 | 824,323 | 1,591,849 | +1.6% |
| Mar 2026 | 774,936 | 752,520 | 1,527,456 | -4.3% |
| Apr 2026 | 817,993 | 890,861 | 1,708,854 | -0.1% |
| May 2026 | 842,031 | 840,164 | 1,682,196 | +24.1% |
| Jun 2026 | 779,331 | 1,002,734 | 1,782,065 | +11.6% |
| Jul 2026 | 928,509 | 960,464 | 1,888,973 | -3.8% |
| Aug 2026 | 919,992 | 955,907 | 1,875,899 | +0.8% |
| Sep 2026 | 997,177 | 1,042,652 | 2,039,829 | +21.4% |
| Oct 2026 | 937,715 | 1,026,872 | 1,964,587 | +16.4% |